
Veja também


 23.10.2026 04:40 AM
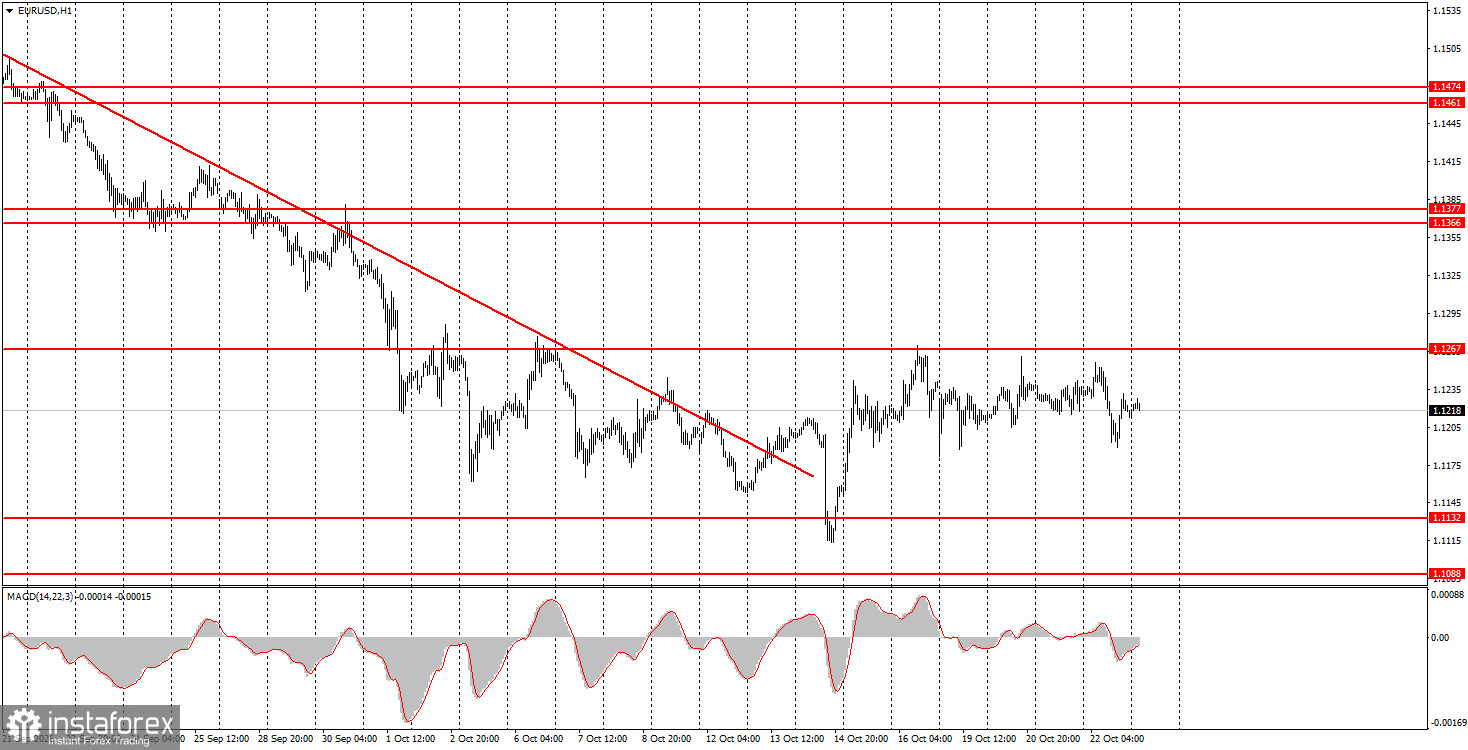
Several macroeconomic releases are scheduled for Friday. Germany, the EU, the UK, and the US will publish October purchasing-managers indices for services and manufacturing. For Germany, the EU and the UK, these are fairly important reports, so the European trading session may be quite active. In the US, the S&P business-activity indices matter less because the country publishes alternative ISM indices that matter more for the market. The UK will also publish a retail-sales report today.
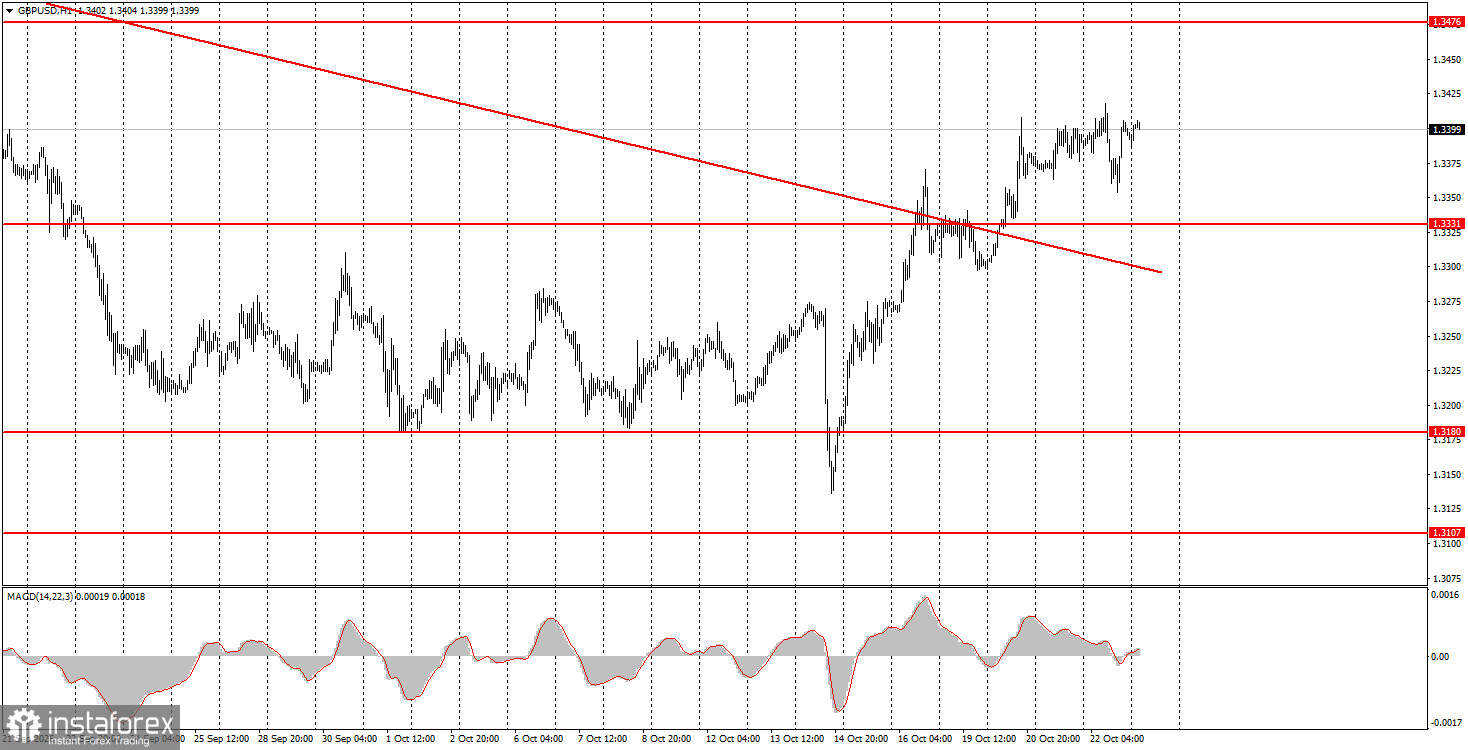
Among Friday's fundamental events, one could single out speeches by European Central Bank Monetary Committee members Cipollone and Montagner, but Christine Lagarde already spoke this week, and the market received no new information. The Federal Reserve and ECB meetings take place next week, so it is unlikely any central-bank official will comment today on policy prospects. Both the ECB and the Fed are about 90% likely to leave key rates unchanged, and further tightening is expected at the December meeting.
The geopolitical backdrop remains poor. The United States and Iran are not conducting official talks at present, although Donald Trump continues to insist a deal could be signed after the US congressional elections. At the same time, reports indicate that the US and Israel could resume strikes on Iran immediately after the midterms, since the likelihood of a deal with Tehran is trending toward zero. We find that scenario more plausible than a ceasefire and an end to the war. Iran, in turn, is ready to resume strikes on US allies in the region.
On the last trading day of the week, currency pairs may trade more actively because a lot of macroeconomic data is being released. The euro can be traded from the 1.1198–1.1218 area, and the pound from the 1.3380–1.3386 area.
Price levels (areas) of support and resistance serve as targets for opening buy or sell trades or as sources of signals.
Red lines indicate channels or trend lines that show the current trend and the preferred trading direction.
The MACD indicator (14,22,3) — the histogram and signal line — is an auxiliary indicator that can also provide signals.
Important speeches and reports (listed in the news calendar) can significantly influence currency pair movements. Therefore, during their release, traders should approach trading with utmost caution, or exit the market to avoid sudden reversals against the preceding move.
Beginner forex traders should remember that not every trade can be profitable. Developing a clear strategy and practicing money management are key to long-term success in trading.


