Bullish Rectangle
was formed on 10.04 at 14:30:16 (UTC+0)
signal strength 3 of 5
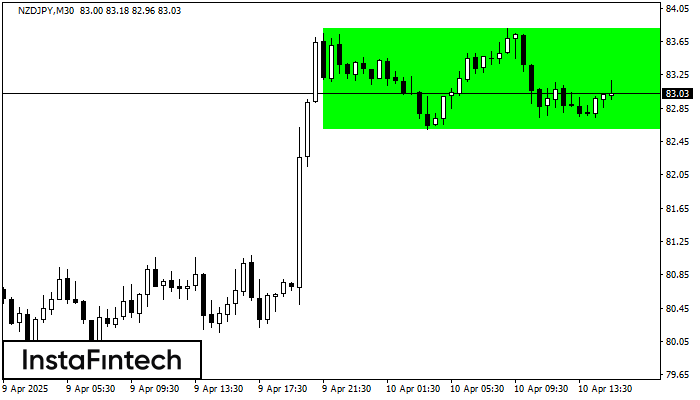
According to the chart of M30, NZDJPY formed the Bullish Rectangle. This type of a pattern indicates a trend continuation. It consists of two levels: resistance 83.80 and support 82.60. In case the resistance level 83.80 - 83.80 is broken, the instrument is likely to follow the bullish trend.
- All
- All
- Bearish Rectangle
- Bearish Symmetrical Triangle
- Bullish Rectangle
- Double Top
- Double Top
- Triple Bottom
- Triple Bottom
- Triple Top
- Triple Top
- All
- All
- Buy
- Sale
- All
- 1
- 2
- 3
- 4
- 5
Bawah Triple
was formed on 25.07 at 09:20:21 (UTC+0)
signal strength 1 of 5
Pola Bawah Triple telah terbentuk pada grafik #Bitcoin M5. Fitur-fitur pola: garis bawah pola memiliki koordinat 116154.33 dengan batas atas 116154.33/115498.43, proyeksi lebar adalah 105419 poin. Pembentukan pola Bawah Triple
Rangka waktu M5 dan M15 mungkin memiliki lebih dari titik entri yang keliru.
Open chart in a new window
Bawah Ganda
was formed on 25.07 at 08:48:34 (UTC+0)
signal strength 1 of 5
Pola Bawah Ganda telah terbentuk pada NZDJPY M5. Karakteristik: level support 88.49; level resistance 88.56; lebar pola 7 poin. Jika level resistance ditembus, perubahan dalam tren dapat diprediksi dengan target
Rangka waktu M5 dan M15 mungkin memiliki lebih dari titik entri yang keliru.
Open chart in a new window
Kepala dan Bahu Terbalik
was formed on 25.07 at 08:48:25 (UTC+0)
signal strength 1 of 5
Menurut grafik M5, #PEP menghasilkan pola yang disebut Kepala dan Bahu Terbalik. The Head ditetapkan di 143.96 sementara garis median The Neck ditetapkan di 144.53/144.50. Formasi Pola Kepala dan Bahu
Rangka waktu M5 dan M15 mungkin memiliki lebih dari titik entri yang keliru.
Open chart in a new window