Vea también

 25.12.2020 10:27 AM
EUR/USD
Analysis:
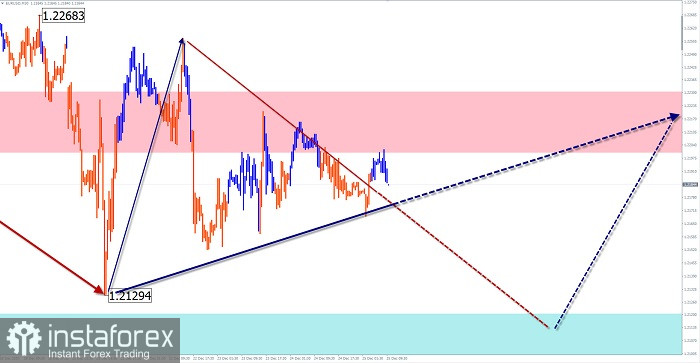
The chart of the major European currency continues to be dominated by an upward trend. After the correction wave that ended on December 21, a reversal pattern is developing on the chart. It will be followed by a breakthrough on the main course.
Forecast:
In the coming day, a general sideways movement is expected. The probable limits of the daily price corridor limit the counter zones. In the first half of the day, you can expect a downward movement vector.
Potential reversal zones
Resistance:
- 1.2200/1.2230
Support:
- 1.2120/1.2090
Recommendations:
The downward trend contradicts the main trend of the euro, thus, sales can be unprofitable. It is recommended to skip this section of the movement and track the buy signals at the end of it.
AUD/USD
Analysis:
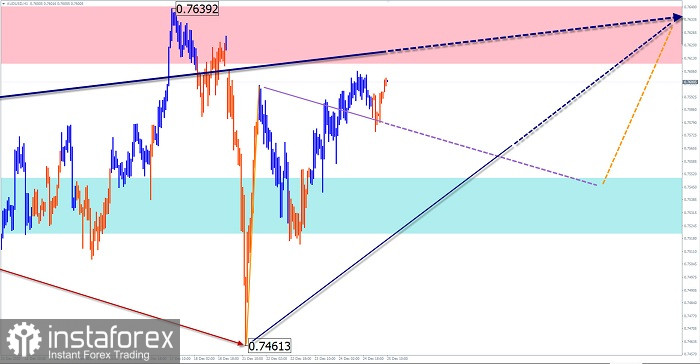
The upward trend of the Australian dollar that began in March continues. In the last unfinished section of November 2, a hidden correction was completed last week. A new section was launched on December 21. Before further breakout of the price up, the price needs to form an intermediate correction.
Forecast:
Today, there is a high probability of price movement in the lateral plane. A short-term decline in the exchange rate is possible, not further than support. The beginning of price growth is expected at the end of the day or next week.
Potential reversal zones
Resistance:
- 0.7610/0.7640
Support:
- 0.7550/0.7520
Recommendations:
There are no conditions for selling the pair today. It is recommended to skip the correction and look for long position entry signals at its end.
Explanation: In the simplified wave analysis (UVA), waves consist of 3 parts (A-B-C). The last incomplete wave is analyzed. The solid background of the arrows shows the formed structure, and the dotted one shows the expected movements.
Attention: The wave algorithm does not take into account the duration of the instrument's movements in time!
You have already liked this post today
*El análisis de mercado publicado aquí tiene la finalidad de incrementar su conocimiento, más no darle instrucciones para realizar una operación.


