Vea también

 11.10.2021 07:04 PM
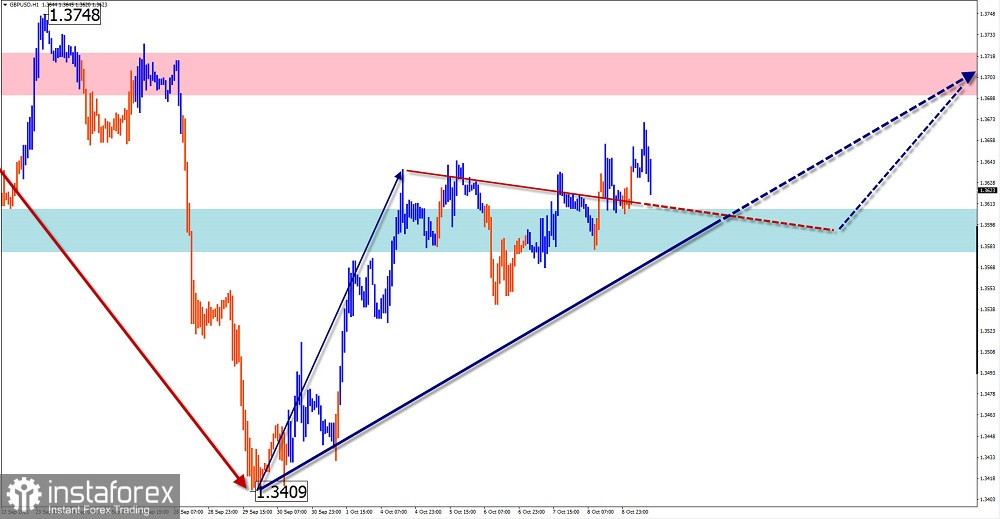
GBP/USD
Analysis:
The British pound market is dominated by an upward trend. The new section on the main course was launched on September 29. Currently, the price is approaching the lower border of the intermediate resistance zone. A correction is formed in the structure of the last segment.
Forecast:
In the upcoming sessions, the price is expected to move between the nearest opposite zones. Pressure on the support zone is likely in the first half of the day. Return to the main course can be expected at the end of the day, or tomorrow.
Potential reversal areas
Resistance:
- 1.3690/1.3720
Support:
- 1.3610/1.3580
Recommendations:
There are no conditions for selling the British pound on the major market today. It is recommended to track reversal signals to buy an instrument in the area of calculated support.
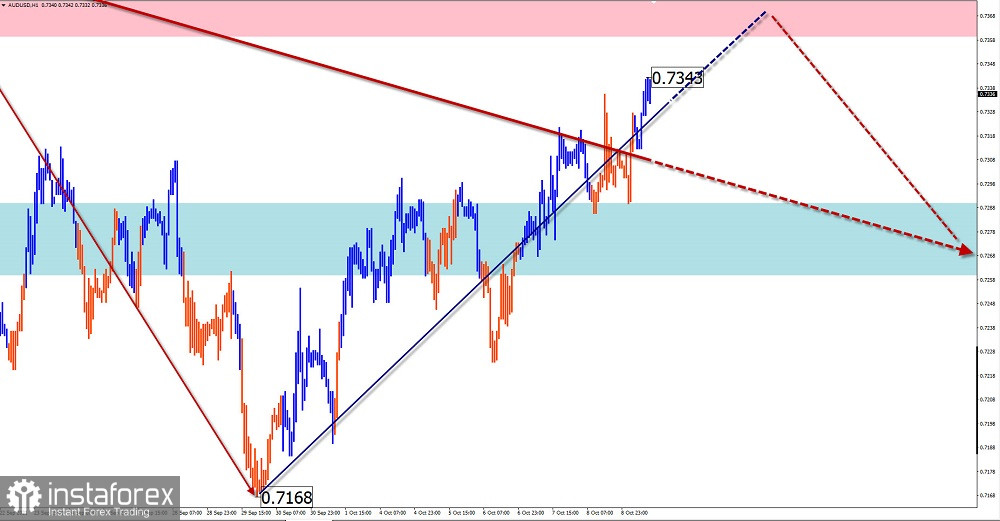
AUD/USD
Analysis:
The main direction of price movement on the Australian currency chart in recent months is set by the downward trend wave from February 25. The last section counts down from September 3. In its structure, an intermediate rollback is nearing completion.
Forecast:
In the next day, it is expected that the price rise will be completed. In the area of the calculated resistance, you can then wait for the formation of a reversal and the beginning of the price's downward movement.
Potential reversal areas
Resistance:
- 0.7360/0.7390
Support:
- 0.7290/0.7260
Recommendations:
Trading in the Australian dollar market today can be risky. It is recommended to wait for the completion of the current growth and in the resistance zone to monitor the signals to sell the pair.
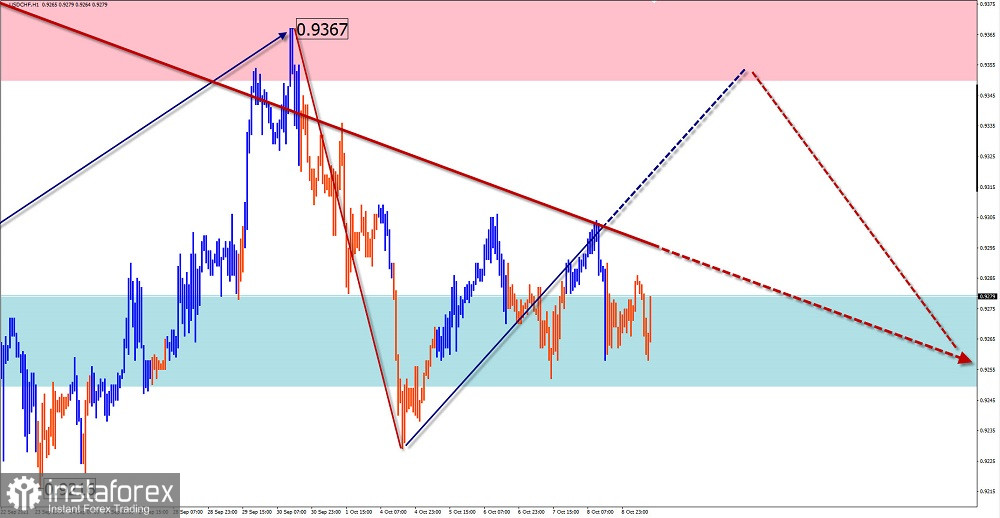
USD/CHF
Analysis:
On the 4-hour scale of the Swiss franc chart, a downward wave continues to form. Its wave structure by now most closely resembles an unfinished sliding plane. The wave lacks the final descending segment. In recent weeks, the price has been within the boundaries of a strong reversal zone of a large TF.
Forecast:
Today, the price movement is expected between opposite zones. After the completion of the flat, a general upward vector is likely. Going beyond the boundaries of the settlement zones is unlikely.
Potential reversal areas
Resistance:
- 0.9330/0.9360
Support:
- 0.9260/0.9230
Recommendations:
There are no selling conditions on the franc market today. It is recommended to track buy signals in the settlement support area. It is safer to lower the trading lot. The upside potential is limited by the calculated resistance.
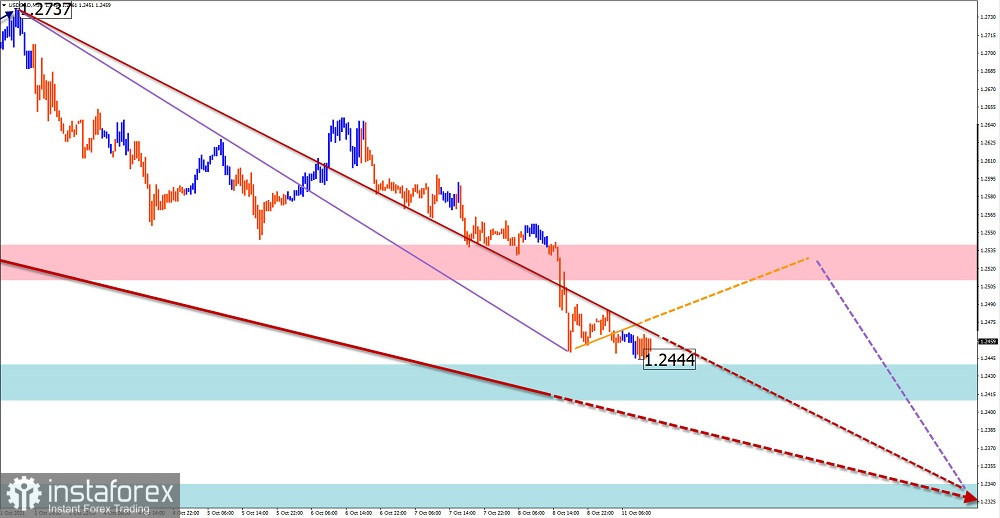
USD/CAD
Analysis:
A flat price pattern developing in the Canadian dollar market forms an extended plane. In the last three weeks, the final part (C) is being formed on the chart. The price reached intermediate support.
Forecast:
Today, the movement is expected in the side plane. A short-term price rise is likely to be no higher than the calculated resistance. At the end of the day or tomorrow, you can expect a resumption of the bearish rate, with a breakout of the lower border of the immediate support.
Potential reversal areas
Resistance:
- 1.2510/1.2540
Support:
- 1.2440/1.2410
- 1.2340/1.2310
Recommendations:
Shopping on the Canadian market today carries increased risks and is not recommended. It is optimal to refrain from entering the pair's market until the completion of the upcoming upward rollback, and look for signals to sell at its end.
Explanations: In simplified wave analysis, waves are composed of 3 parts (A-B-C). The last unfinished wave is analyzed. The solid background of the arrows shows the formed structure, the dashed lines show the expected movements.
Attention: The wave algorithm does not take into account the duration of the instrument's movements in time.


