empty
18.10.2021 11:12 AM
Simplified wave analysis and forecast for GBP/USD, AUD/USD, USD/CHF, USD/CAD on October 18

GBP/USD

Analysis:

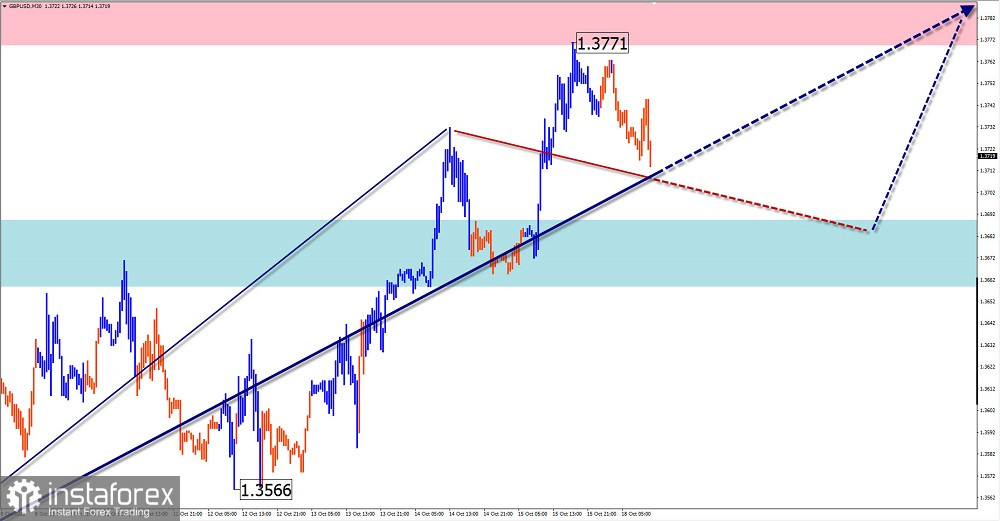
Over the past year and a half, the trend of the British pound has been aimed at strengthening its position relative to the US dollar. The ascending section that began on September 29 completed the wave's middle part (B), giving rise to the final part (C). The price reached the intermediate resistance zone.

Forecast:

Today, a general sideways course of price movement between the nearest oncoming zones is expected. A downward vector to the support zone is likely after an attempt to put pressure on the resistance zone.

Potential reversal zones

Resistance:

- 1.3770/1.3800

Support:

- 1.3690/1.3660

Recommendations:

Today, trading in the pound has increased risks and can be unprofitable. It is recommended to refrain from entering the pair's market until the end of the downward pullback and to look for buy signals at its end.

This image is no longer relevant

AUD/USD

Analysis:

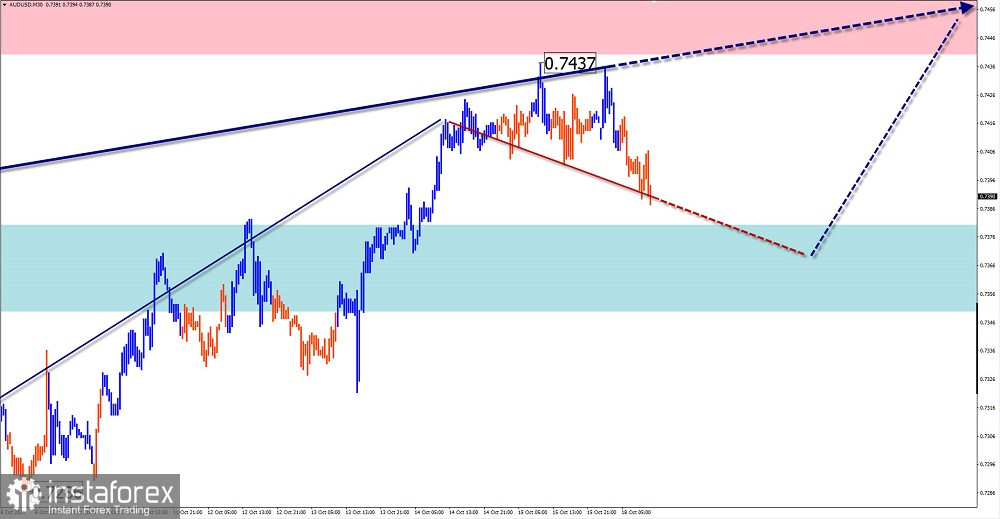
On the chart of the major pair of the Australian dollar, the downward wave that began in February continues. Since July 21, quotes have been forming a counter correction of the wrong kind, which has not yet been completed.

Forecast:

The general upward course of the movement is expected to continue today. In the next session, a short-term decline in the area of the support zone is possible. Active growth of the exchange rate can be expected at the end of the day or tomorrow.

Potential reversal zones

Resistance:

- 0.7440/0.7470

Support:

- 0.7380/0.7350

Recommendations:

There are no conditions for sale in the Australian dollar market today. It is recommended to monitor the reversal signals for the purchase of the instrument in the area of settlement support.

This image is no longer relevant

USD/CHF

Analysis:

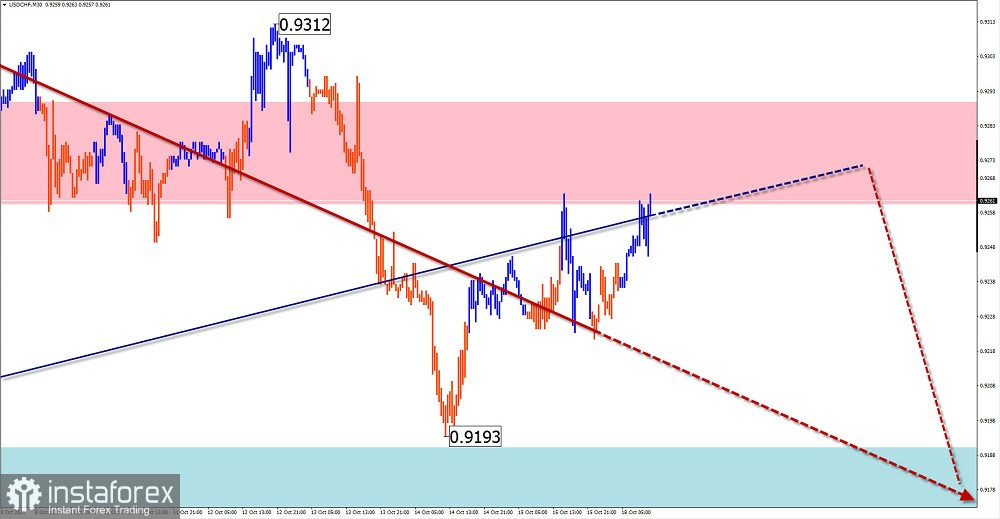
A descending wave in the form of a shifting plane has been forming on the Swiss franc chart since mid-June. The wave structure lacks the final part (C). Quotes in the last two weeks form an intermediate horizontal pullback.

Forecast:

The general flat nature of the price movement is expected in the upcoming sessions. A descending vector is more likely. There are few chances for a breakthrough of settlement zones within the current day.

Potential reversal zones

Resistance:

- 0.9260/0.9290

Support:

- 0.9190/0.91600

Recommendations:

Today, trading transactions on the franc market are possible only within the framework of individual sessions in small lots. Settlement zones limit the potential for price fluctuations.

This image is no longer relevant

USD/CAD

Analysis:

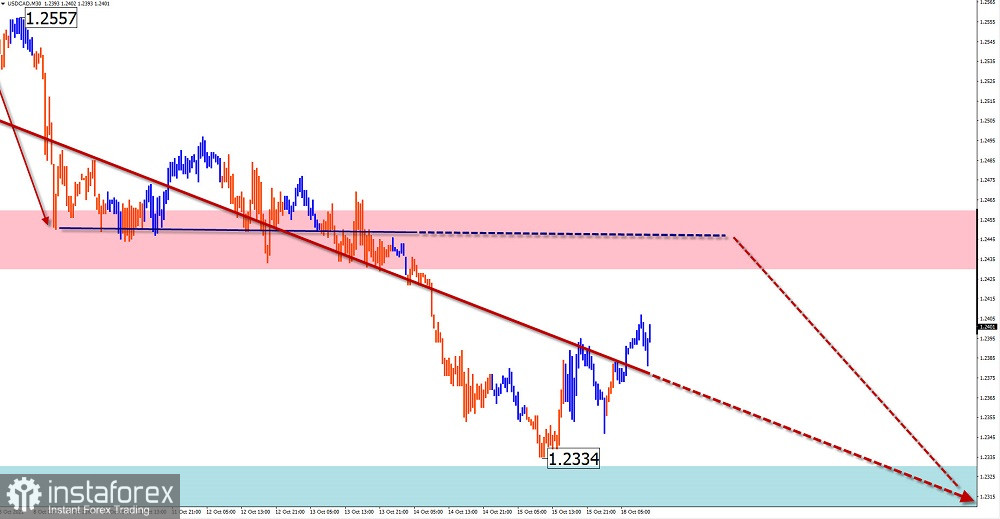
A downward stretched plane has been forming on the Canadian dollar major pairs market since July 19. The wave structure has entered the final phase, forming the last part of the wave (C). The price has reached intermediate support.

Forecast:

You can expect the price to move in the side corridor between the oncoming zones in the coming day. In the first half of the day, an upward vector is more likely. A reversal and a return to the bearish rate are expected.

Potential reversal zones

Resistance:

- 1.2430/1.2460

Support:

- 1.2360/1.2330

Recommendations:

Today, trading transactions on the Canadian market are riskier and can lead to losses. It is recommended to refrain from entering the pair's market until the entire pullback is completed, followed by a sale in the area of the resistance zone.

This image is no longer relevant

Explanations: In the simplified wave analysis (UVA), waves consist of 3 parts (A-B-C). The last incomplete wave is analyzed. The solid background of the arrows shows the formed structure, and the dotted one shows the expected movements.

Attention: The wave algorithm does not take into account the duration of the instrument's movements in time!

Recommended Stories

SP500 25 de abril. ¡Subimos siguiendo a Bitcoin!

Desde el punto de vista de las ondas de Elliott, en el índice se está formando una gran tendencia impulsiva en una perspectiva global. No hace mucho se completó

Roman Onegin 10:06 2025-04-25 UTC+2

NG 12 Feb. ¡Los toros mantienen el rumbo hacia un máximo de 4,31!

El marco temporal de cuatro horas muestra el trazado de una onda activa principal (Y), que tiene una forma interna compleja y es un doble zigzag de un nivel

Roman Onegin 07:26 2025-02-12 UTC+2

SP500 12 de febrero. ¡Después de la finalización de la segunda parte del impulso, el precio puede subir más activamente!

Lo más probable es que se esté formando una tendencia alcista mayor en el panorama global del SP500, cuya estructura es similar a la del impulso. Si nos fijamos

Roman Onegin 07:26 2025-02-12 UTC+2

Análisis del par EUR/USD. El 7 de julio. ¿Dónde se encuentra la raíz de todos los problemas del dólar?

El conteo de ondas en el gráfico de 4 horas para el instrumento EUR/USD permanece sin cambios. Actualmente estamos observando la formación de la supuesta onda

Chin Zhao 15:58 2024-07-07 UTC+2

Análisis del par EUR/USD. El 6 de julio. El destino complicado del dólar.

El conteo de ondas en el gráfico de 4 horas para el instrumento EUR/USD permanece sin cambios. Actualmente estamos observando la formación de la supuesta onda

Chin Zhao 15:57 2024-07-07 UTC+2

Análisis del par GBP/USD. El 6 de julio. La libra quiere caer, pero no puede.

La estructura de ondas del instrumento GBP/USD sigue siendo bastante complicada y muy confusa. Alrededor del nivel de 1.2822, que corresponde al 23.6% de Fibonacci y está cerca del pico

Chin Zhao 15:57 2024-07-07 UTC+2

Análisis del par GBP/USD. El 22 de junio. El mercado espera la primera bajada de los tipos de interés en agosto.

El patrón de onda para el instrumento GBP/USD sigue siendo bastante complicado y confuso. Un intento exitoso de romper el nivel de Fibonacci del 50,0% en abril indicó

Chin Zhao 13:12 2024-06-22 UTC+2

Análisis del par EUR/USD. El 22 de junio. La Fed: No está lista para el aterrizaje.

En el gráfico de 4 horas, no hay cambios en la marca de la onda para el instrumento EUR/USD. En este momento, observamos la construcción de la esperada onda

Chin Zhao 10:51 2024-06-22 UTC+2

Análisis del par GBP/USD. El 8 de junio. Los británicos retrocedieron, pero no se rindieron.

El patrón de onda para el instrumento GBP/USD sigue siendo bastante complicado. El intento exitoso de romper el nivel de Fibonacci del 50,0% en abril indicó que el mercado está

Chin Zhao 08:27 2024-06-09 UTC+2

Análisis del par EUR/USD. El 8 de junio. El BCE confía en una mayor desaceleración de la inflación.

El patrón de onda del gráfico de 4 horas para el instrumento EUR/USD se mantiene sin cambios. En este momento, estamos observando la construcción de la onda esperada

Chin Zhao 08:26 2024-06-09 UTC+2
¿No puede hablar ahora mismo?
Ingrese su pregunta en el chat.
 

Dear visitor,

Your IP address shows that you are currently located in the USA. If you are a resident of the United States, you are prohibited from using the services of InstaFintech Group including online trading, online transfers, deposit/withdrawal of funds, etc.

If you think you are seeing this message by mistake and your location is not the US, kindly proceed to the website. Otherwise, you must leave the website in order to comply with government restrictions.

Why does your IP address show your location as the USA?

  • - you are using a VPN provided by a hosting company based in the United States;
  • - your IP does not have proper WHOIS records;
  • - an error occurred in the WHOIS geolocation database.

Please confirm whether you are a US resident or not by clicking the relevant button below. If you choose the wrong option, being a US resident, you will not be able to open an account with InstaTrade anyway.

We are sorry for any inconvenience caused by this message.