empty
30.10.2024 05:08 PM
Forecast of EUR/USD pair on October 30, 2024

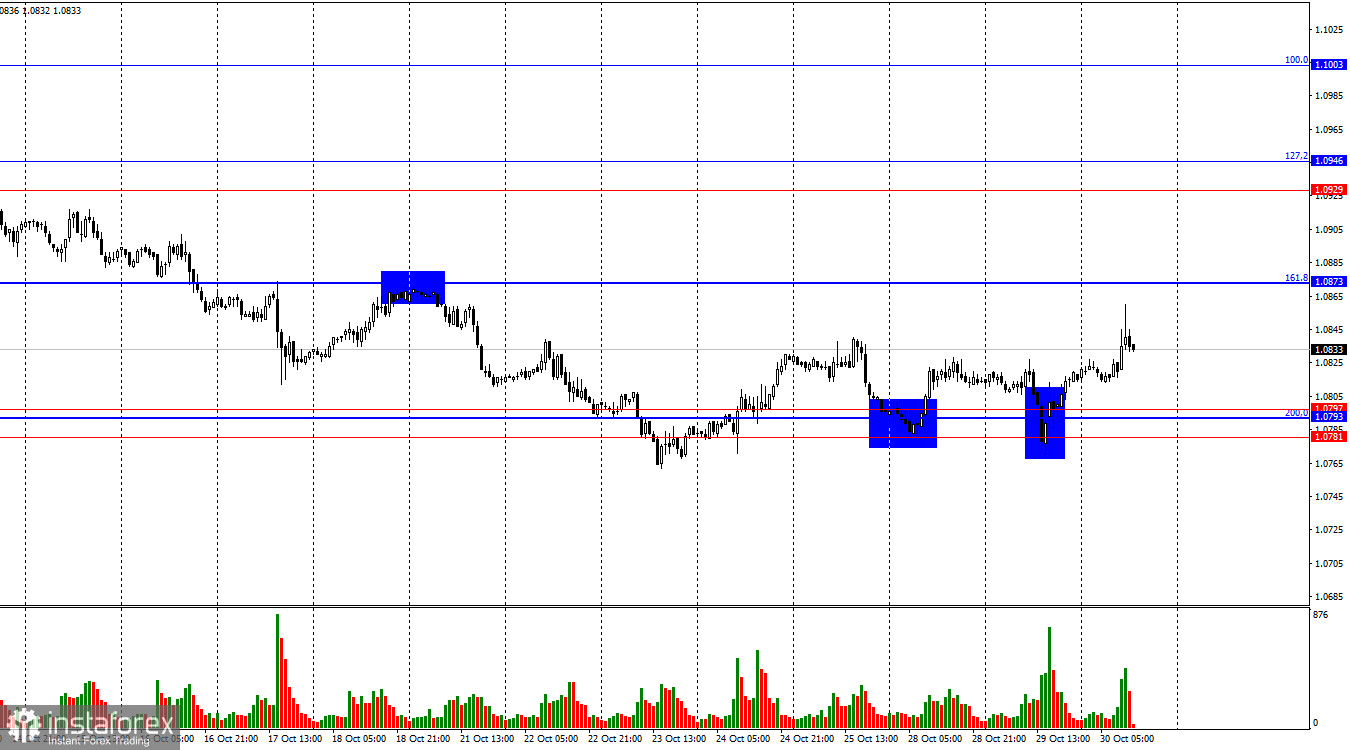
On Tuesday, the EUR/USD pair completed its third rebound from the support zone of 1.0781–1.0797, turning in favor of the euro and starting a new climb toward the much-contested 161.8% corrective level at 1.0873. A rebound from this level would favor the U.S. dollar and prompt a fourth test of the 1.0781–1.0797 zone. Consolidating below this zone would increase the likelihood of a further decline toward the next Fibonacci level of 261.8% at 1.0662.

This image is no longer relevant

The wave pattern raises no questions. The last completed upward wave (September 25–30) did not surpass the previous wave's peak, while the new downward wave (still in formation) has broken the lows of the past three waves. Thus, the pair is continuing to form a new bearish trend, particularly its first wave. While a corrective wave could appear soon, bulls have already lost their market momentum. Regaining it would require substantial effort, which is unlikely to happen in the near future.

Tuesday's news backdrop was relatively weak and didn't have a strong impact on the pair's exchange rate. This morning, it was reported that Germany's unemployment rate rose to 6.1% (contrary to traders' expectations), Q3 GDP volumes increased by 0.2% (also unexpected by traders), and Eurozone GDP rose by 0.4% (exceeding forecasts). This prompted a reasonable response from bullish traders, though their buying power was short-lived. The euro rose by 40 points, only to fall by 20 points shortly after. This afternoon, two significant U.S. reports are expected, which will determine the day's overall dynamics. American reports hold greater market importance. Currently, traders still see no compelling reason to buy the euro. With the fourth or fifth test, the 1.0781–1.0797 zone might not hold, leading to another sharp decline in the euro.

This image is no longer relevant

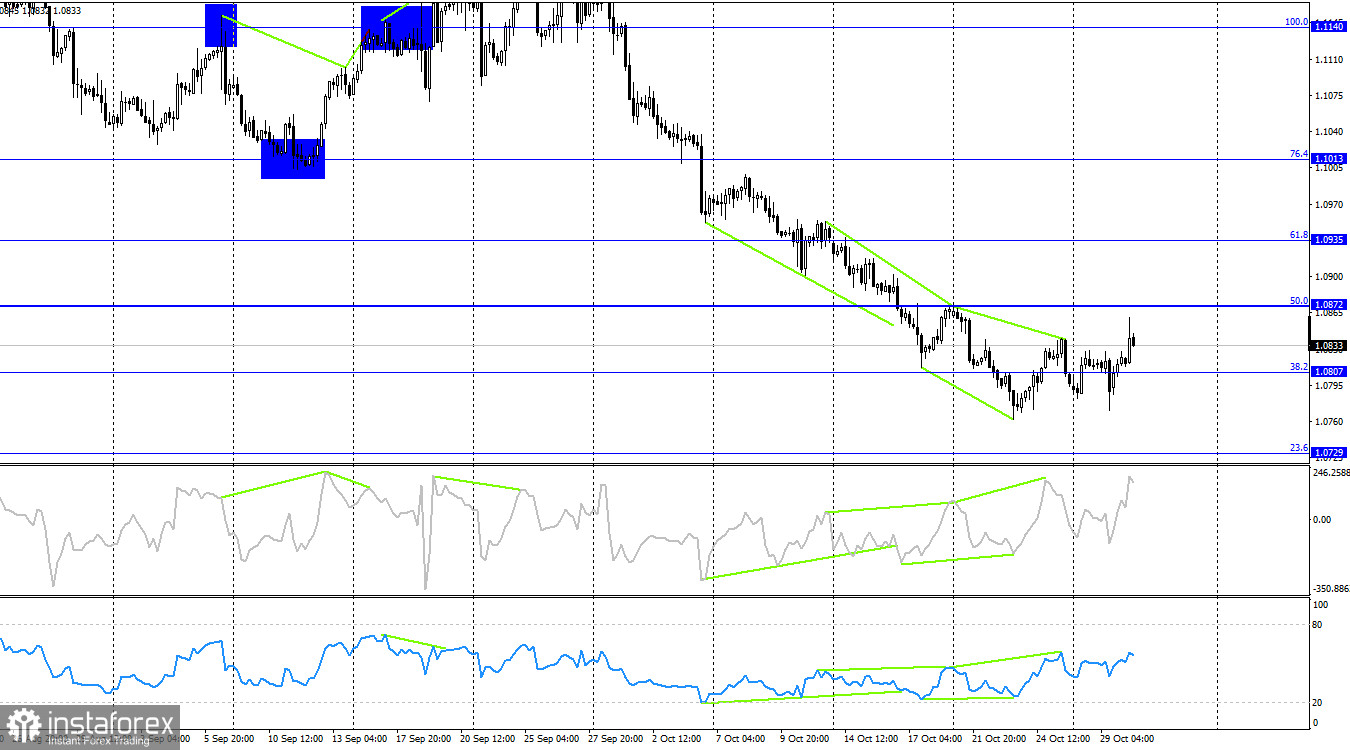
On the 4-hour chart, the pair is attempting to continue its upward movement toward the 50.0% corrective level at 1.0872, but bulls remain very weak. A rebound from this level would suggest a reversal in favor of the U.S. dollar, with a renewed decline toward the 23.6% Fibonacci level at 1.0729. Currently, no divergences are forming on any indicators.

Commitments of Traders (COT) Report:

This image is no longer relevant

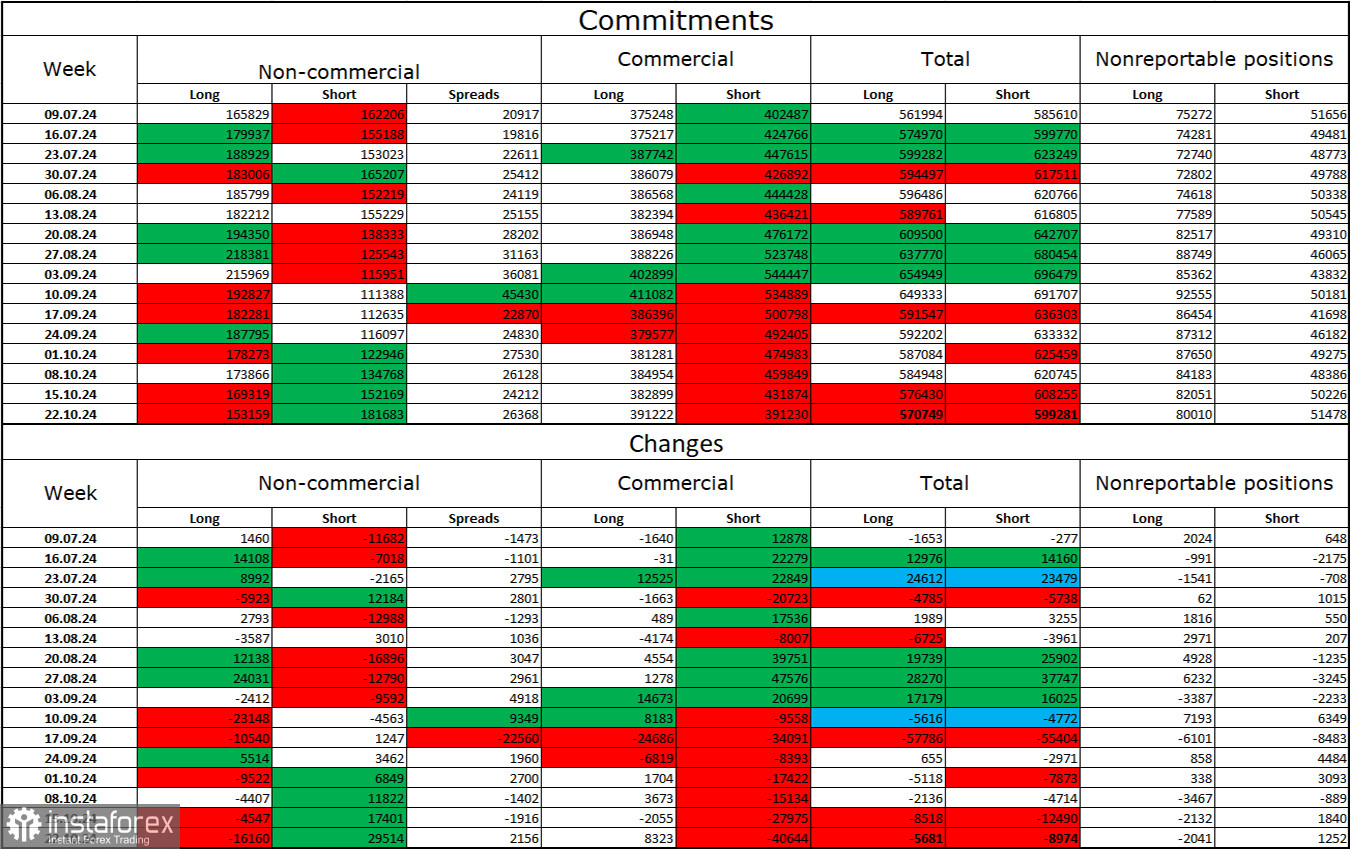
In the latest reporting week, speculators closed 16,160 long positions and opened 29,514 short positions. The sentiment among the "Non-commercial" group shifted to bearish. The total number of long positions held by speculators now stands at 153,000, while short positions total 181,000.

For the seventh consecutive week, major players are unloading the euro. In my view, this could signal the beginning of a new bearish trend or at least a significant correction on a global scale. The key factor driving the dollar's decline—expectations of Fed policy easing—has already been priced in, leaving the market with fewer reasons to offload the dollar. New factors could arise, but for now, further dollar strength seems more likely. Technical analysis also indicates the start of a bearish trend, suggesting a prolonged decline for EUR/USD.

Economic Calendar for the U.S. and Eurozone:

  • Eurozone – Germany Unemployment Rate (08:55 UTC)
  • Eurozone – Q3 GDP Change in Germany (09:00 UTC)
  • Eurozone – Q3 GDP Change (10:00 UTC)
  • U.S. – ADP Employment Change (12:15 UTC)
  • U.S. – Q3 GDP Change (12:30 UTC)
  • Eurozone – Germany Consumer Price Index (13:00 UTC)

On October 30, the economic calendar contains several significant events, half of which have already been released. The impact of this information on market sentiment for the rest of the day is expected to be moderate.

EUR/USD Forecast and Trader Tips:

Selling the pair is possible on a close below the 1.0781–1.0797 zone on the hourly chart, targeting 1.0729, or on a rebound from the 1.0873 level. Buying opportunities existed on a rebound from the 1.0781–1.0797 zone with a target of 1.0873; however, bullish traders are currently very weak, with even the news background offering limited support.

Fibonacci levels are plotted from 1.1003 to 1.1214 on the hourly chart and from 1.1139 to 1.0603 on the 4-hour chart.

Recommended Stories

Bitcoin. El fortalecimiento del dólar podría dar un giro bajista al mercado de criptomonedas

Hoy, el mercado se centrará en la publicación del informe sobre la inflación en Estados Unidos, que se espera que muestre no solo que ha dejado de bajar, sino

Pati Gani 13:12 2025-06-11 UTC+2

Bitcoin. El logro de nuevos máximos puede detenerse

El precio del Bitcoin superó momentáneamente el nuevo nivel histórico de 111 000, pero no logró consolidarse por encima de él. El apoyo proviene, tanto para él como para

Pati Gani 10:53 2025-05-22 UTC+2

EUR/USD. El 12 de mayo. El conflicto en Ucrania podría llegar a su fin.

Buenos días, estimados traders. El par EUR/USD el viernes subió hacia la zona de resistencia 1,1265 – 1,1282, rebotó desde allí y giró a favor del dólar estadounidense. El proceso

Samir Klishi 10:27 2025-05-12 UTC+2

Pronóstico para el gas al 8 de abril de 2025

Gas natural (NG) Ni al final de la semana pasada, ni mucho menos al comienzo de la actual, la cotización del gas natural logró superar la resistencia de 4.200, reforzada

Laurie Bailey 08:11 2025-04-08 UTC+2

Pronóstico del gas para el 17 de marzo de 2025

Gas natural (NG) La jornada de hoy se abrió por encima de la línea indicadora Kruzenshtern en el marco diario. Al mismo tiempo, el oscilador Marlin cambió de dirección hacia

Laurie Bailey 07:02 2025-03-17 UTC+2

Pronóstico para el Bitcoin el 21 de febrero de 2025

Bitcoin El Bitcoin ha cambiado de opinión sobre el desarrollo de una caída hacia soportes objetivos cómodos, y en su lugar, siguiendo el sentimiento de riesgo general, ha revertido desde

Laurie Bailey 07:23 2025-02-21 UTC+2

Bitcoin - análisis técnico de la situación

Viernes, y el Bitcoin sigue esperando. Ninguna de las partes enfrentadas tiene prisa por presentarse y ser activa. En la incertidumbre actual, el posicionamiento de los principales índices de referencia

Evangelos Poulakis 07:45 2025-02-14 UTC+2

Previsión para el gas natural (GN) del 5 de febrero de 2025

En el gráfico semanal la semana pasada el precio se revirtió desde el nivel de soporte 3.017 - desde los máximos de septiembre 2024, agosto 2023, febrero 2023 y también

Laurie Bailey 07:51 2025-02-05 UTC+2

#NDX - análisis técnico de la situación

A finales del año pasado, el índice marcó un nuevo máximo histórico (22141), tras lo cual se detuvo la subida, comenzó la formación de la corrección y la consolidación. Ahora

Evangelos Poulakis 07:24 2025-02-04 UTC+2

Bitcoin 30 Enero - análisis técnico de la situación

A pesar de marcar un nuevo máximo la semana pasada (109986), el Bitcoin detuvo su tendencia alcista y comenzó a formar incertidumbre. Hasta ahora, el formato semanal ha proyectado

Evangelos Poulakis 07:24 2025-01-30 UTC+2
¿No puede hablar ahora mismo?
Ingrese su pregunta en el chat.
 

Dear visitor,

Your IP address shows that you are currently located in the USA. If you are a resident of the United States, you are prohibited from using the services of InstaFintech Group including online trading, online transfers, deposit/withdrawal of funds, etc.

If you think you are seeing this message by mistake and your location is not the US, kindly proceed to the website. Otherwise, you must leave the website in order to comply with government restrictions.

Why does your IP address show your location as the USA?

  • - you are using a VPN provided by a hosting company based in the United States;
  • - your IP does not have proper WHOIS records;
  • - an error occurred in the WHOIS geolocation database.

Please confirm whether you are a US resident or not by clicking the relevant button below. If you choose the wrong option, being a US resident, you will not be able to open an account with InstaTrade anyway.

We are sorry for any inconvenience caused by this message.