Vea también

 14.04.2025 08:12 AM
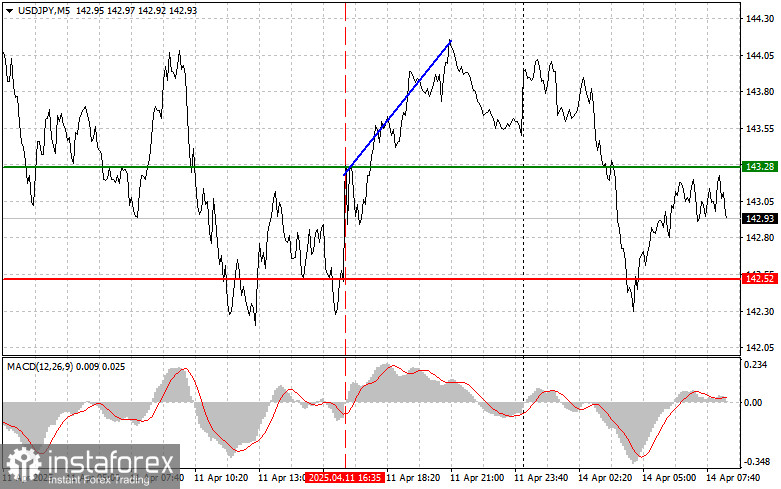
The price test at 143.28 occurred when the MACD indicator had just started moving up from the zero line, confirming a valid entry point for buying the dollar. As a result, the pair rose by 70 pips.
The March U.S. Producer Price Index data was a pleasant surprise for traders, although it didn't provide strong support for the dollar. The initial reaction was a sell-off in USD/JPY, but demand for the yen soon weakened. While such news opens the door for the Federal Reserve to ease monetary policy by lowering interest rates, it is unclear when the central bank will take action. As long as tariff uncertainties persist, the Fed is unlikely to move. Therefore, it is better to continue betting on the further downside in USD/JPY along the trend, while current corrections should be viewed as good opportunities to sell at more attractive prices.
For intraday strategy, I will focus primarily on implementing Scenarios #1 and #2.
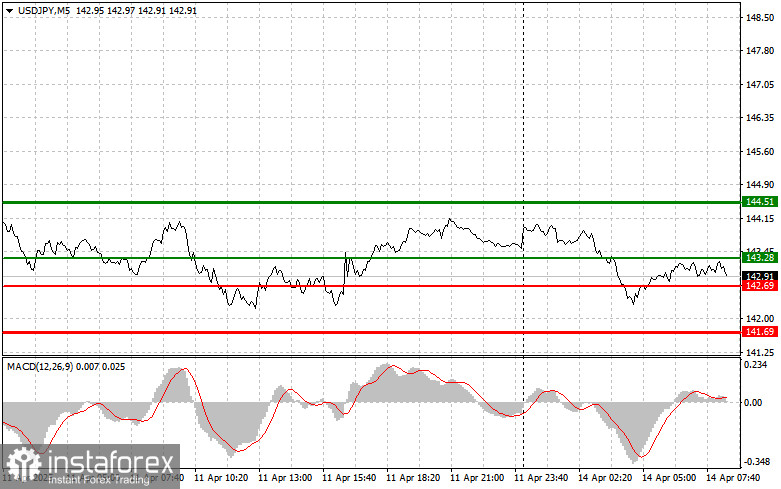
Scenario #1: I plan to buy USD/JPY today at the entry point around 143.28 (green line on the chart), targeting a rise to 144.51 (thicker green line on the chart). Around 144.51, I plan to exit long positions and open short positions in the opposite direction, expecting a 30–35 pip pullback. It's best to return to buying the pair on pullbacks and deeper corrections in USD/JPY.
Important: Before buying, ensure the MACD indicator is above the zero line and beginning to rise.
Scenario #2: I also plan to buy USD/JPY today in case of two consecutive tests of the 142.69 level while the MACD is in oversold territory. This will likely limit the pair's downside potential and lead to an upward reversal. In this case, a rise toward the opposite levels of 143.28 and 144.51 can be expected.
Scenario #1: I plan to sell USD/JPY only after breaking below the 142.69 level (red line on the chart), which should trigger a sharp decline in the pair. The main target for sellers will be 141.69, where I plan to exit short positions and immediately open long positions in the opposite direction, aiming for a 20–25 pip rebound. Selling pressure on the pair could return at any moment.
Important: Before selling, ensure that the MACD indicator is below the zero line and beginning to decline.
Scenario #2: I also plan to sell USD/JPY today if there are two consecutive tests of the 143.28 level while the MACD is in overbought territory. This would limit the pair's upside potential and lead to a reversal downward. In this case, a decline toward the opposite levels of 142.69 and 141.69 is expected.