
Vea también


 11.08.2026 08:00 AM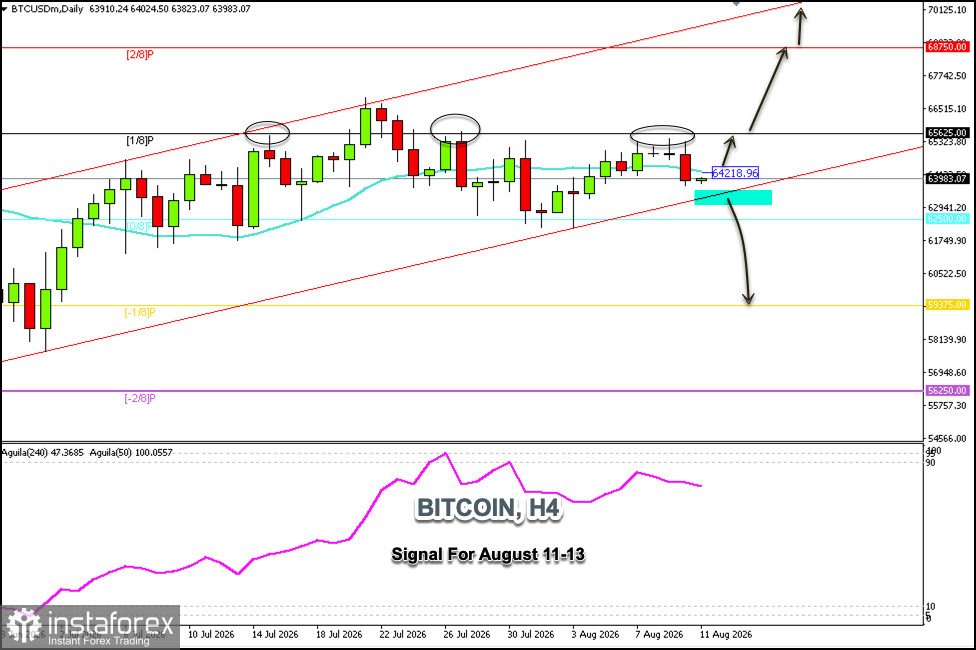
Bitcoin is trading around $63,983, below the 21-day SMA and within an uptrend channel that has been forming since early July. On the daily chart, we can see that Bitcoin is struggling to break above the $65,625 zone, as it has been attempting to do so over the past week but has been unsuccessful.
Today's daily chart shows a decline in Bitcoin, and there could be a sharp downward acceleration if there is a decisive break below the uptrend channel. If this occurs, we could expect it to reach $62,500 and potentially even hit the psychological level of $60,000.
Conversely, if Bitcoin consolidates above $64,218 in the coming hours, we could expect a recovery, and there could be strong momentum to push above $65,600, as this level acts as a key support for BTC.
If Bitcoin quickly surpasses $65,625 in the coming days, it could reach the 2/8 Murray level around $68,750 and might even hit the psychological level of $70,000, which would coincide with the upper band of the uptrend channel.
We should monitor Bitcoin's price movement closely in the coming hours; a drop below $63,000 could change Bitcoin's outlook and potentially trigger a bearish cycle, while a move above $65,000 could signal a further uptrend.
You have already liked this post today
*El análisis de mercado publicado aquí tiene la finalidad de incrementar su conocimiento, más no darle instrucciones para realizar una operación.


