
Vea también


 21.10.2026 07:48 AM
The four-hour (H4) chart for Bitcoin (#Bitcoin) shows active price movement, with the asset currently trading at 82,890.33. It is attempting to stabilize and consolidate following a recent downward pullback that saw the price approach support levels near the Weekly Pivot point.
Technical Analysis and Price Action
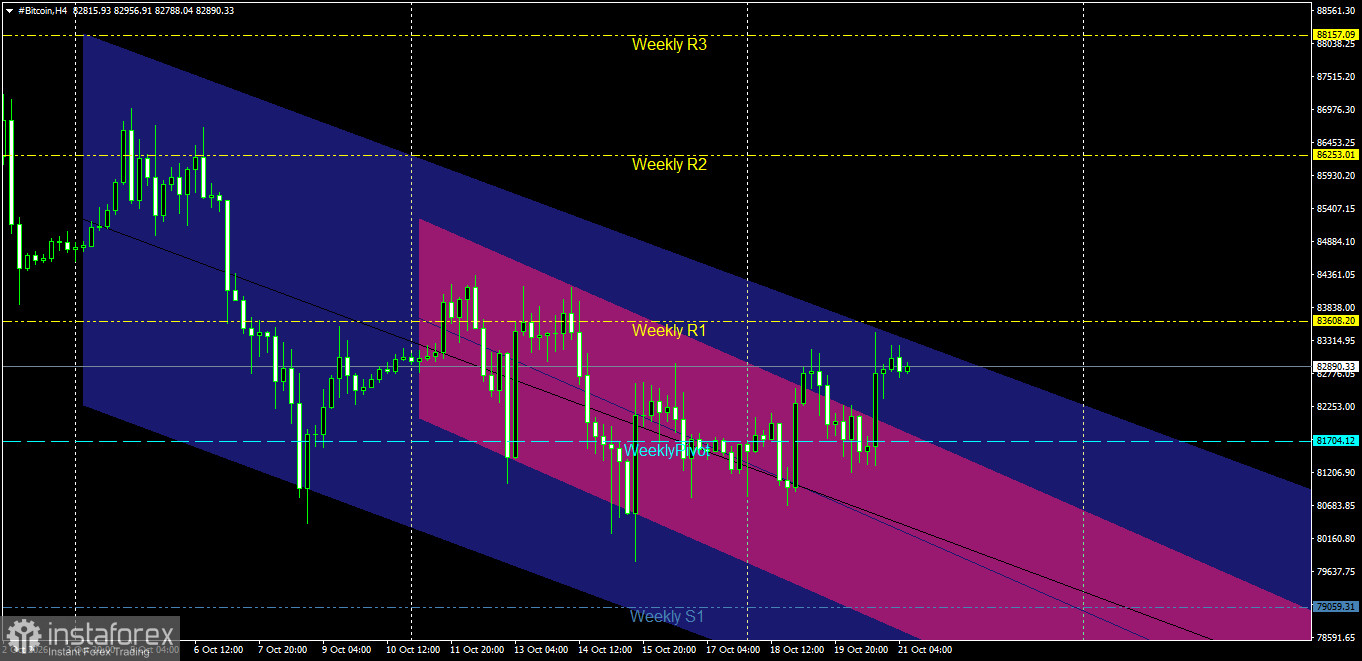
Price Channel Structure: The price is moving within a broad, primary descending channel (in blue), which intersects with a secondary, corrective descending channel (in pink/red). Notably, the price has rebounded strongly from the lower boundary of the channel, crossing above the median line toward higher levels within the range; this has established a local bottom, with the price now targeting nearby resistance boundaries.
Interaction with Pivot Levels: The price is currently fluctuating above the Weekly Pivot point, located at 81,704.12. This stability serves as a positive signal, supporting ongoing attempts at a short-term recovery. Meanwhile, the price faces its first hurdle at the first weekly resistance level (Weekly R1)—situated at 83,608.20—which represents the most significant immediate challenge for buyers.
Key Support and Resistance Levels
Primary Resistance Levels:
First Resistance: 83,608.20 (Weekly R1).
Second Resistance: 86,253.01 (Weekly R2). Key Resistance: 88157.09 (Weekly R3 resistance level and the upper boundary of the channel).
Key Support Levels:
First Support: 81704.12 (Weekly Pivot point and current pivotal support level).
Second Support: 80600.00 – 81000.00 (Near-term intraday support zones).
Main Support: 79059.31 (Lower boundary of the descending channel and Weekly S1 support level).
Price Action Outlook and Trading Recommendations
Bullish Scenario (Primary):
A positive trajectory is likely in the intraday timeframe, provided the price remains above the Weekly Pivot point of 81704.12.
Recommendation: Consider buying upon a positive rebound or if the price stabilizes above the 81704.12 level.
Technical Targets: The first target is the Weekly R1 resistance level at 83608.20; a firm breakout above this could lead to an extension toward 86253.01.
Bearish Scenario (Alternative):
This scenario is triggered if the price fails to break through the resistance and faces renewed selling pressure, causing it to break below the Weekly Pivot point.
Confirmation Condition: A 4-hour candle close below the 81704.12 level.
Technical Targets: A retest of the nearby support zones at 80600.00, followed by a decline toward the lower boundary of the channel near 79059.31. Risk Management
Trading cryptocurrencies requires strict adherence to capital management rules. This includes limiting the risk per trade to a maximum of 2% and utilizing stop-loss orders to protect your portfolio from the sharp, sudden volatility characteristic of crypto markets.
Analysis of Today's Candle:
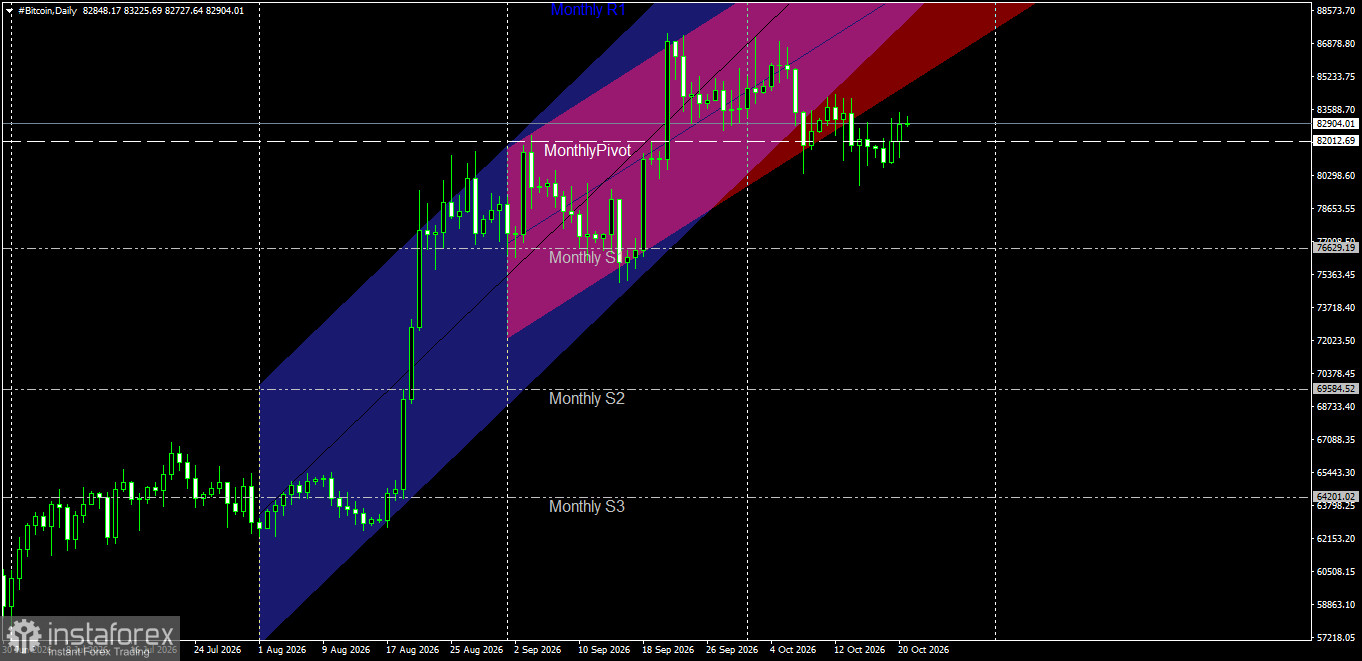
The current daily candle shows attempts at a positive rebound and a recovery in buying momentum, with the price successfully holding above the monthly pivot level, thereby paring losses from previous sessions.
Outlook for Future Price Movement:
Bullish Scenario: This remains the more likely outcome, provided the price maintains a daily close above the pivot point of 82,012.69. In this case, the price could target higher resistance levels and the upper boundaries of the ascending channel.
Bearish Scenario: This would be triggered if intense selling pressure emerges, pushing the price to break below the monthly pivot and close beneath it. Such a move could open the door for a deeper downward correction toward the next monthly support levels.


