Vea también

 30.04.2026 06:29 AM
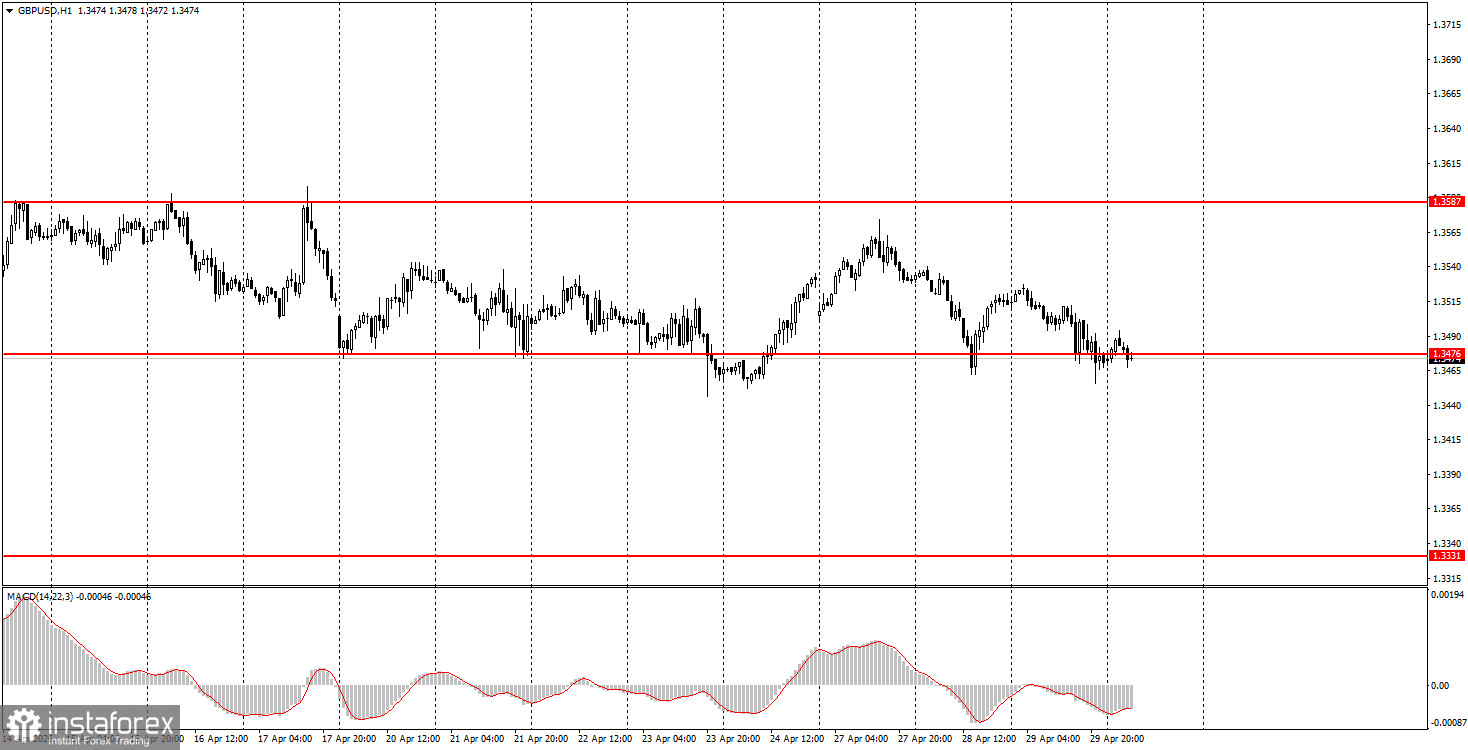
The GBP/USD pair showed no meaningful movement on Wednesday, despite important U.S. reports and the FOMC meeting in the evening. This was Jerome Powell's last meeting as the head of the central bank. Although Jerome Powell indicated the possibility of loosening monetary policy in the near future (the market did not expect a rate cut by the end of the year due to rising inflation), traders did not feel the need to react to this important statement. There was a slight spike in volatility, but it was negligible. In fact, the British pound continued to trade within a sideways channel, attempting to breach its lower boundary for the eighth time, and, for the eighth time, it failed. Nothing changed on the market by the end of Wednesday. Well, we can only hope that the Bank of England will at least stir up the currency market today. However, to be honest, there is little hope for that. The market has been ignoring key fundamental and macroeconomic events for two months, focusing only on geopolitics. And now there are no geopolitical news updates either, and the influence of geopolitical factors on market sentiment has weakened.
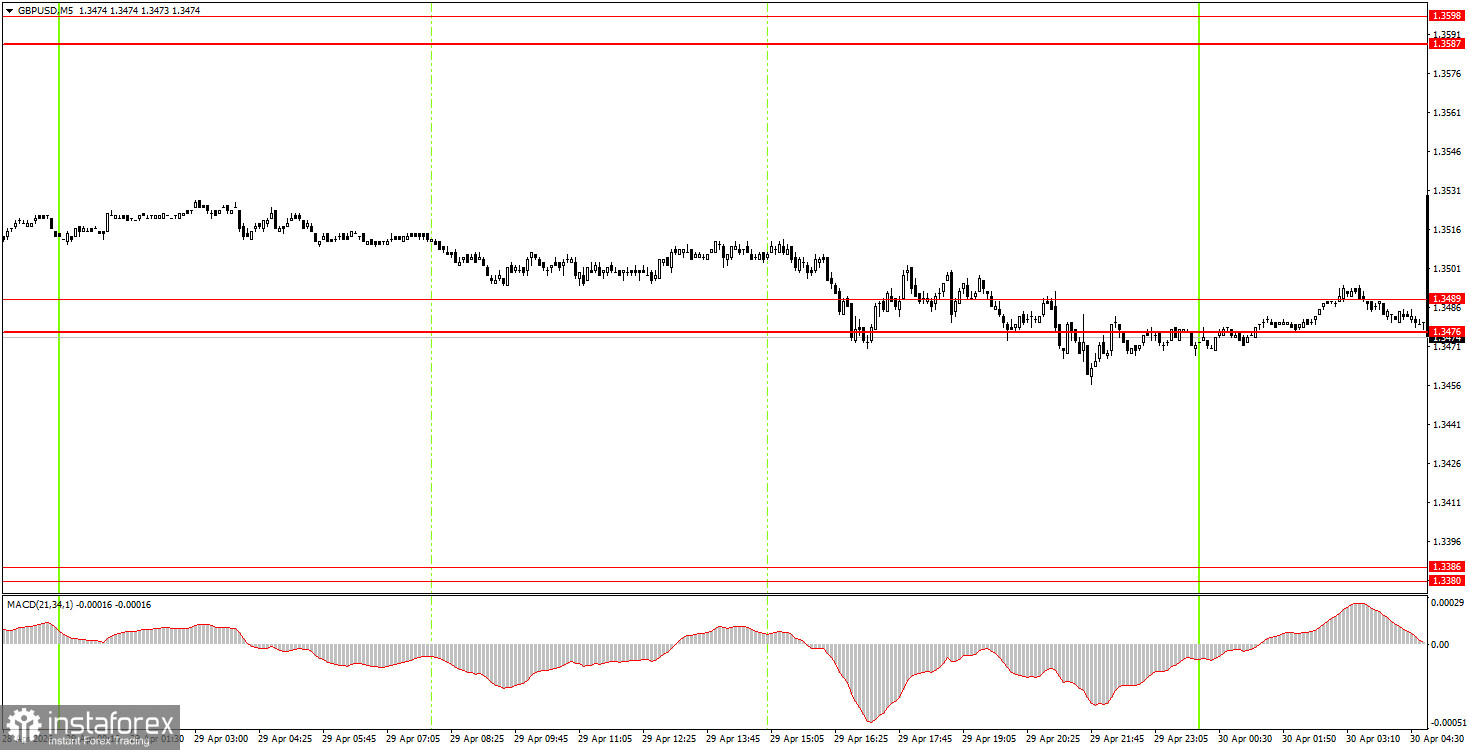
On the 5-minute timeframe on Wednesday, no clear trading signals were formed. By the end of the day, the pair tested the 1.3476-1.3489 range, which serves as the lower boundary of the sideways channel on the hourly timeframe, but no clear rebound or breakout was observed.
On the hourly timeframe, the GBP/USD pair continues to form an upward trend, but for the last two weeks, it has been trading in a range. There are still no clear global reasons for the medium-term growth of the dollar, so we expect the global upward trend to resume in 2026. Without a serious escalation in the Middle East, the dollar will not be able to sustain the growth it has shown over the past two months. Individual events may still provoke their strengthening, but overall, the geopolitical factor has taken a back seat.
On Thursday, beginner traders may open short positions if the price consolidates below 1.3476-1.3489, targeting 1.3380-1.3386. A new rebound from the area of 1.3476-1.3489 will allow for opening long positions with a target of 1.3587-1.3598. However, volatility remains low, and the market is not reacting to the drivers.
On the 5-minute timeframe, the following levels can currently be traded: 1.3175-1.3180, 1.3259-1.3267, 1.3319-1.3331, 1.3380-1.3386, 1.3476-1.3489, 1.3587-1.3598, 1.3695, 1.3741-1.3751. Today's Bank of England meeting will take place in the UK, and traders may ignore it with the same success as yesterday's FOMC meeting. In the U.S., we would also note the GDP report for the first quarter, but the likelihood of strong movement here is also low.
Price levels of support and resistance are levels that serve as targets when opening buys or sells. Take Profit levels can be placed around them.
Red lines represent channels or trend lines that show the current trend and indicate the direction in which it is preferable to trade now.
The MACD indicator (14,22,3) – the histogram and the signal line – is a supporting indicator that can also be used as a source of signals.
Important speeches and reports (always included in the news calendar) can significantly affect the movement of the currency pair. Therefore, during their release, trading should be done with utmost caution, or traders should exit the market to avoid sharp price reversals against the previous movement.
Beginning traders in the forex market should remember that not every trade can be profitable. Developing a clear strategy and effective money management are the keys to long-term trading success.


