
Vea también


 13.07.2026 09:54 AM
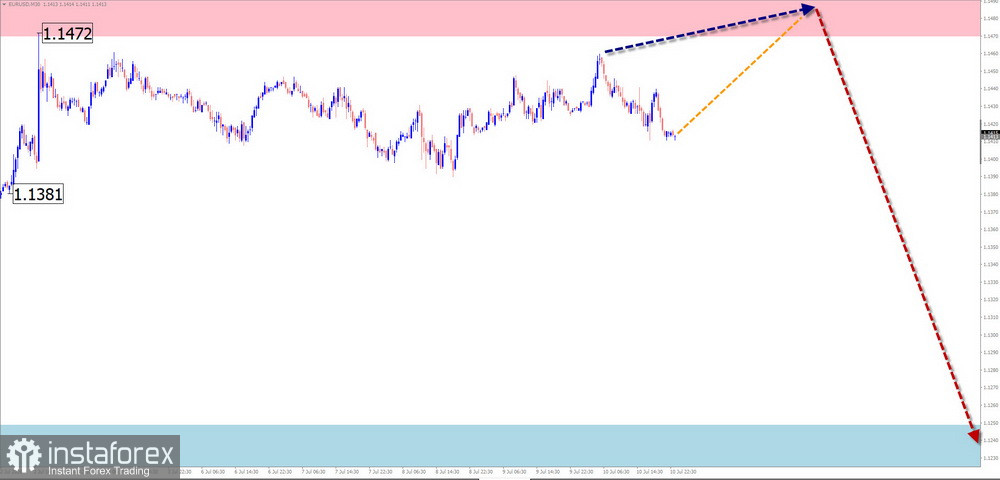
On the chart of the major European currency pair, the downward wave that has been dominant since the end of January this year continues to develop. Two weeks ago, after breaking through strong support, the price consolidated below this level within a sideways flat, forming an intermediate correction of the latest segment of wave (C). Once it is fully completed, the price decline is expected to resume.
In the upcoming week, the euro is expected to continue moving within an overall sideways price vector. In the first few days, an upward movement is more likely, but it is expected to remain below the boundaries of the resistance zone. After that, a reversal may form, followed by a resumption of the downward movement vector. A sharp increase in volatility is highly likely when the direction changes.
Resistance:
Support:
Buy positions: have limited potential and may be considered intraday with a reduced volume size.
Sell positions: may become profitable if emerging reversal signals are monitored near the reversal zone.
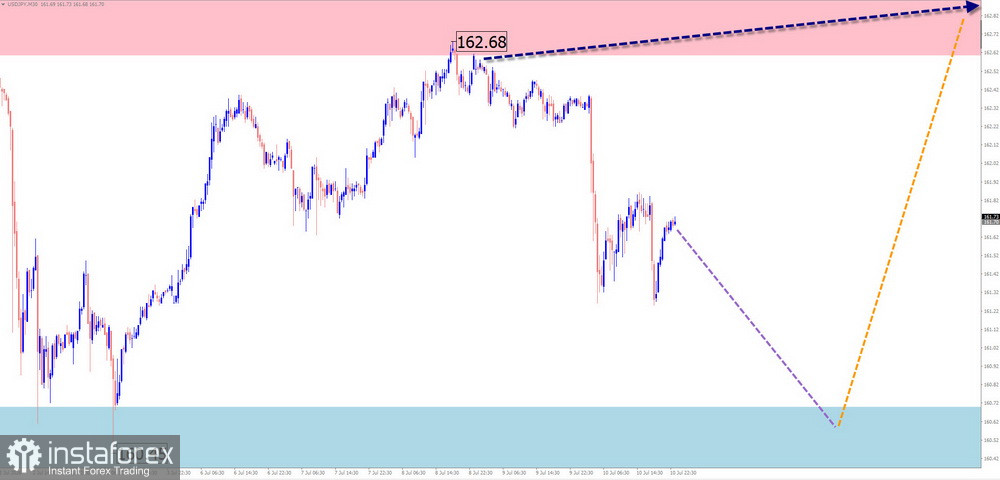
The four-hour chart of the main Japanese yen pair shows the formation of an upward wave pattern that has been developing since the end of April this year. Its unfinished segment has been forming since the beginning of July. Within the wave structure, a corrective wave (B) is developing in the form of an irregular flat. At the time of analysis, this wave segment does not show signs of completion.
At the beginning of the upcoming week, a downward bias in the pair's price movement is expected. A decline is possible toward the calculated support zone. In the second half of the week, conditions may form for a resumption of price growth. When the direction changes, a brief break below the lower boundary of the zone cannot be ruled out. An increase in volatility is likely toward the end of the week.
Resistance:
Support:
Sell positions: are risky and suitable only for intraday trading. The volume size should be reduced as much as possible.
Buy positions: may be profitable if emerging reversal signals are monitored near the support zone.
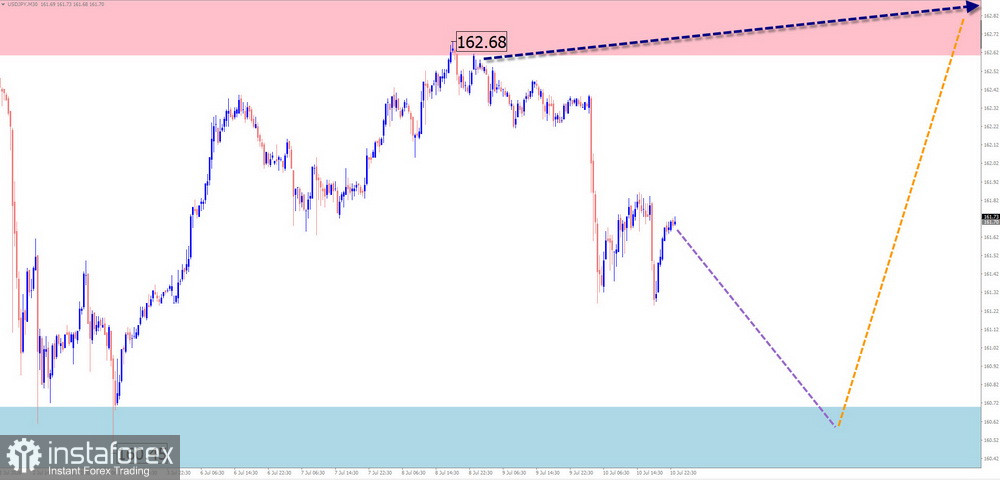
The direction of movement in the pound/yen pair has been upward since February. This trend is confirmed by the higher timeframe trend. The price is approaching the lower boundary of a weekly-scale potential reversal zone. At the time of analysis, the structure indicates the need for a correction of the latest segment of the main wave.
At the beginning of the upcoming week, a continuation of the downward movement vector can be expected, potentially until it is completed near the support area. After that, the pair is expected to reverse and resume its upward course. A breakout beyond the expected range during the upcoming week is unlikely.
Resistance:
Support:
Sell positions: may be profitable during individual sessions with a reduced volume size. It is recommended to close positions at the first signs of a reversal.
Buy positions: will become relevant after signals of a trend change appear near the calculated support zone.
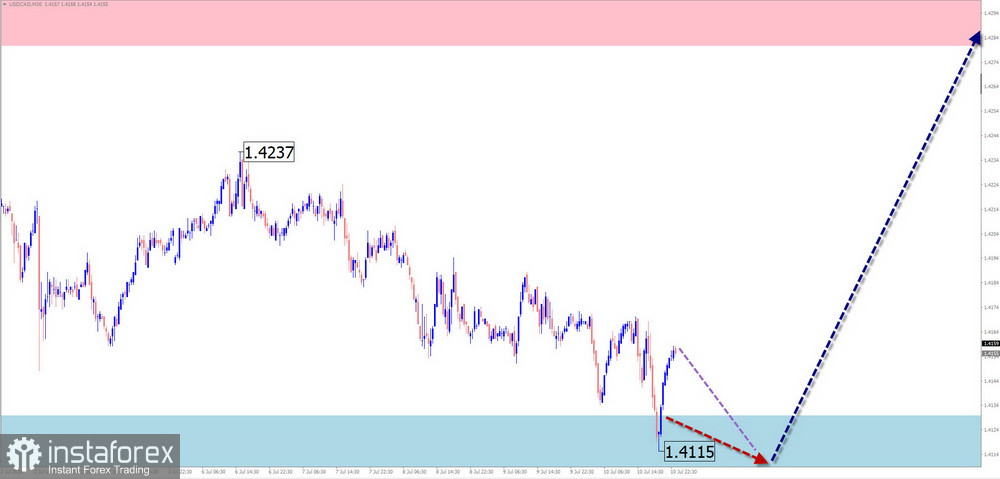
The direction of the Canadian dollar's price movement in the major pair has been determined by a downward wave algorithm since the beginning of May this year. Since the end of June, a counter irregular flat has been developing on the chart, remaining within the bounds of a correction. Its structure lacks the final segment. In recent days, the price has been moving predominantly sideways.
At the beginning of next week, the sideways vector is expected to continue along the calculated support zone. In the second half of the week, a reversal and a resumption of the bullish direction are expected. Against the backdrop of important economic news releases, a sharp increase in volatility cannot be ruled out.
Resistance:
Support:
Buy positions: may be profitable during individual sessions. It is recommended to close positions at the first signs of a reversal.
Sell positions: have no potential during the upcoming week.
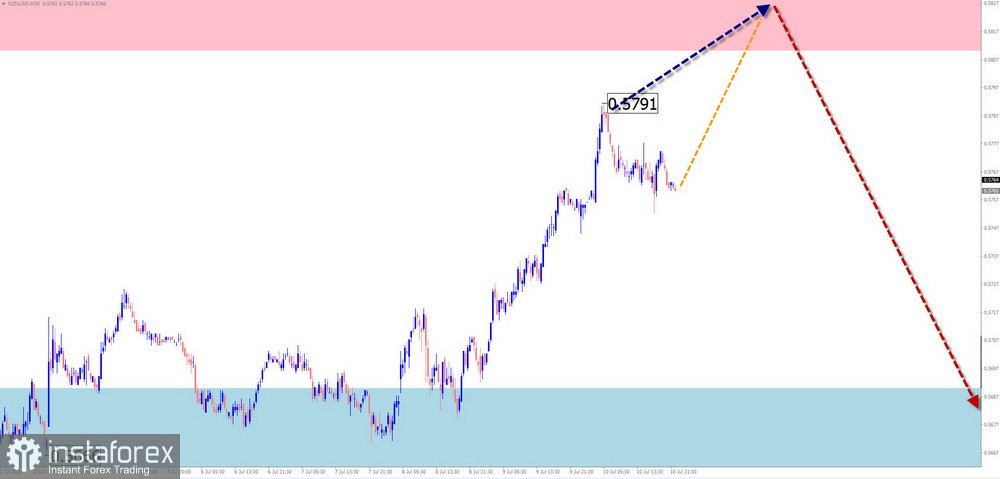
On the chart of the New Zealand dollar major pair, a downward wave zigzag has been forming since January. After the corrective flat that has been developing over the past three weeks, conditions are being created for a continuation of movement in the main direction. This wave segment is not complete at the time of analysis.
In the first few days of the upcoming week, an upward movement toward the boundaries of the calculated resistance zone can be expected. After that, a reversal is expected, followed by a decline in quotations toward the support zone. When the direction changes, a brief break above the upper boundary of the resistance zone cannot be ruled out. The highest volatility is likely toward the end of the week.
Resistance:
Support:
Sell positions: may become the main trading direction after confirmed reversal signals appear.
Buy positions: may be used with a fractional volume size during individual sessions. The potential is limited by resistance.
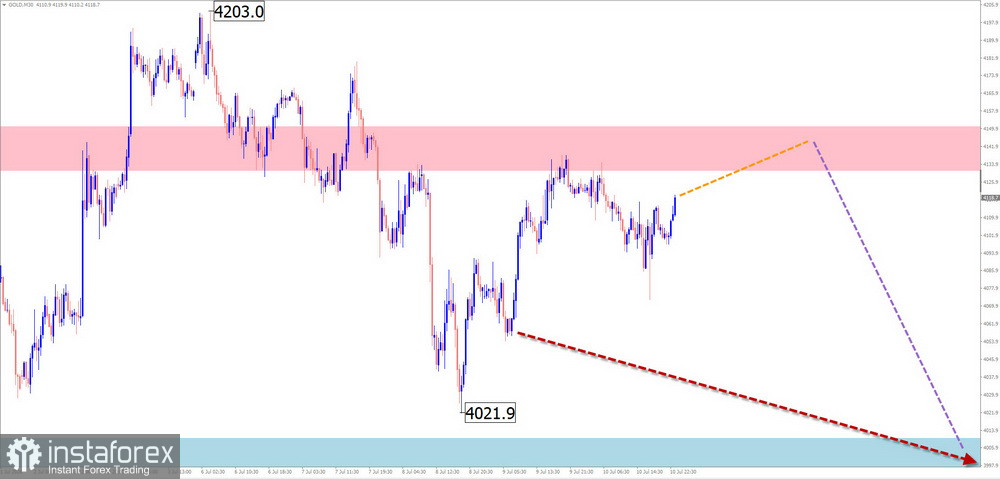
The latest wave structure of the gold index, which remains unfinished at the time of analysis, is downward and has been developing since the end of January this year. Within this bearish wave, the final part (C) has been forming since the end of June. The unfinished counter wave segment of this pattern has been developing since July 9. The price is located in an area where resistance levels from different chart timeframes are concentrated.
Over the next couple of days, the overall sideways price movement is expected to continue along the boundaries of the calculated resistance zone. After that, a reversal and downward price movement can be expected. During the change of direction, the possibility of a brief break above the upper boundary of the zone cannot be ruled out. The support zone represents the lower boundary of the instrument's expected weekly range.
Resistance:
Support:
Sell positions: may become the main trading direction after the appearance of corresponding confirmed signals from your trading system.
Buy positions: are risky and may result in losses. It is optimal to remain out of the market until reversal signals appear.
In simplified wave analysis (SWA), all waves consist of three parts (A-B-C). On each timeframe, the latest unfinished wave is analyzed. Dashed lines indicate the expected movements.
Attention: the wave algorithm does not take into account the duration of instrument movements over time.


