


Los patrones son modelos gráficos que se forman en el gráfico mediante el precio. Según uno de los postulados del análisis técnico, la historia (movimiento del precio) se repite. Esto quiere decir que los movimientos del precio a menudo son similares en las mismas situaciones que hacen posible pronosticar el futuro desarrollo de la situación con una alta probabilidad.
Los patrones relevantes de InstaTrade son un servicio fácil de utilizar que permiten que conozca los últimos cambios en el mercado y reaccione a las pistas del mercado a tiempo. En nuestro servicio, siempre encontrará los últimos y más importantes patrones en cualquier par y en cualquier marco de tiempo.
Double Top
was formed on 27.03 at 00:00:20 (UTC+0)
signal strength 5 of 5
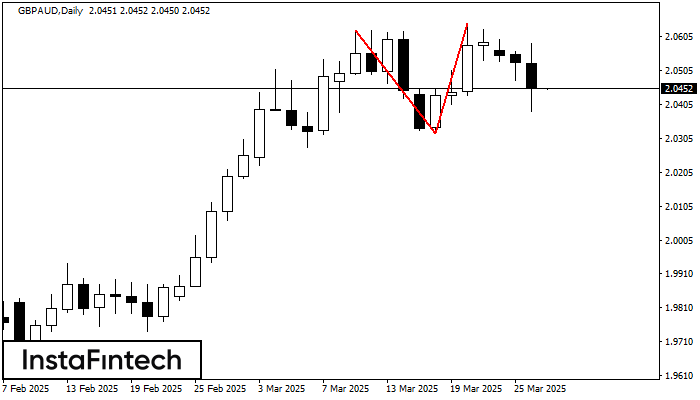
On the chart of GBPAUD D1 the Double Top reversal pattern has been formed. Characteristics: the upper boundary 2.0644; the lower boundary 2.0321; the width of the pattern 323 points. The signal: a break of the lower boundary will cause continuation of the downward trend targeting the 2.0281 level.


