Bearish Symmetrical Triangle
was formed on 10.04 at 20:02:22 (UTC+0)
signal strength 3 of 5
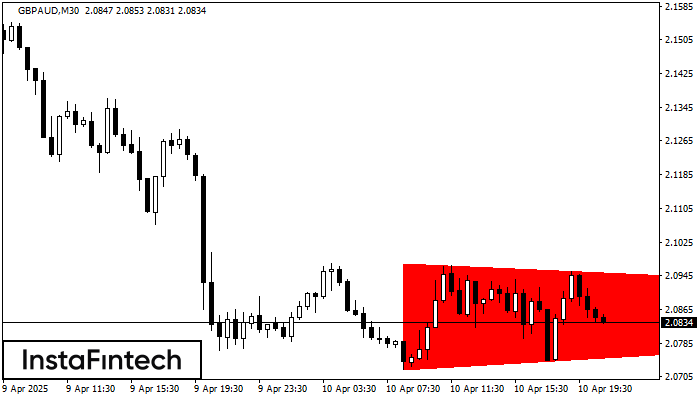
According to the chart of M30, GBPAUD formed the Bearish Symmetrical Triangle pattern. Description: The lower border is 2.0723/2.0864 and upper border is 2.0974/2.0864. The pattern width is measured on the chart at -251 pips. The formation of the Bearish Symmetrical Triangle pattern evidently signals a continuation of the downward trend. In other words, if the scenario comes true and GBPAUD breaches the lower border, the price could continue its move toward 2.0834.
- All
- All
- Bearish Rectangle
- Bearish Symmetrical Triangle
- Bullish Rectangle
- Double Top
- Double Top
- Triple Bottom
- Triple Bottom
- Triple Top
- Triple Top
- All
- All
- Buy
- Sale
- All
- 1
- 2
- 3
- 4
- 5
Banderín bajista
was formed on 25.07 at 14:30:08 (UTC+0)
signal strength 2 of 5
El patrón Banderín bajista se ha formado en el gráfico GBPAUD M15. Esto señala la continuación potencial de la tendencia existente. Especificaciones: el piso del patrón tiene la coordinada
Los marcos de tiempo M5 y M15 pueden tener más puntos de entrada falsos.
Open chart in a new window
Doble Piso
was formed on 25.07 at 14:00:19 (UTC+0)
signal strength 2 of 5
El patrón Doble Piso ha sido formado en NZDUSD M15; el límite superior es 0.6010; el límite inferior es 0.6000. El ancho del patrón es 11 puntos. En caso
Los marcos de tiempo M5 y M15 pueden tener más puntos de entrada falsos.
Open chart in a new window
Cabeza y Hombros Inverso
was formed on 25.07 at 13:55:30 (UTC+0)
signal strength 1 of 5
Según el gráfico de M5, AUDCHF formó el patrón Cabeza y Hombros Inverso. El techo de la Cabeza está establecido en 0.5232 mientras la línea media del Cuello se encuentra
Los marcos de tiempo M5 y M15 pueden tener más puntos de entrada falsos.
Open chart in a new window