อ่านรายละเอียดเพิ่มเติม
Operational scale Minute (time frame h4 )
US Dollar remains on the offensive in the battle for the metals? - Review of options for the movement of Gold & Silver from October 20, 2020.
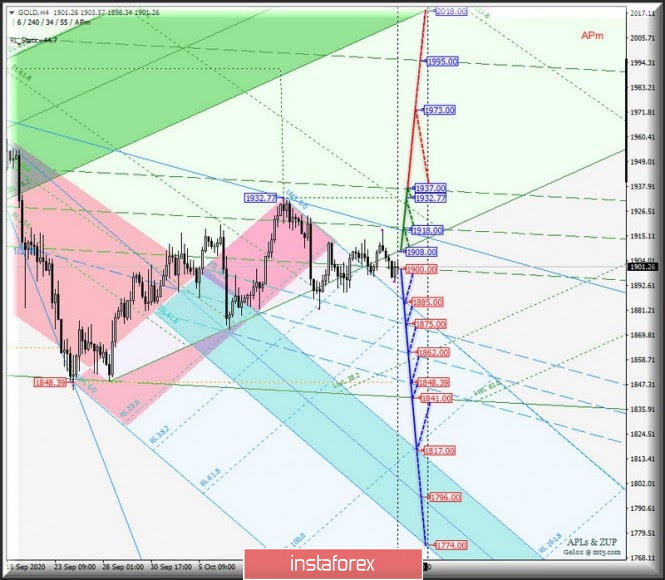
____________________
Spot Gold
The development of Spot Gold movement from October 20 2020 will be determined by the development and direction of the range breakdown:
Breakdown of the lower boundary of the 1/2 Median Line Minute channel - support level 1900.00 - a variant of the development of the downward movement of Spot Gold to the initial SSL Minuette line ( 1885.00 ) and the boundaries of the 1/2 Median Line Minuette channel ( 1875.00 - 1862.00 - 1848.00 ) with the prospect of the price reaching the instrument the control line LTL Minute ( 1841.00 ) and the upper limit of ISL38.2 ( 1817.00 ) of the balance zone of the pitchfork of the Minute Operational Scale.
In case of breakdown of the initial line of the SSL pitchfork of the Minute Operating Scale - resistance level 1908.00. The development of the Spot Gold movement will again begin to occur within the 1/2 Median Line Minute channel ( 1900.00 - 1918.00 - 1937.00 ), taking into account the working out of the local maximum 1932.77 and with the prospect of reaching another local maximum of 1973.00.
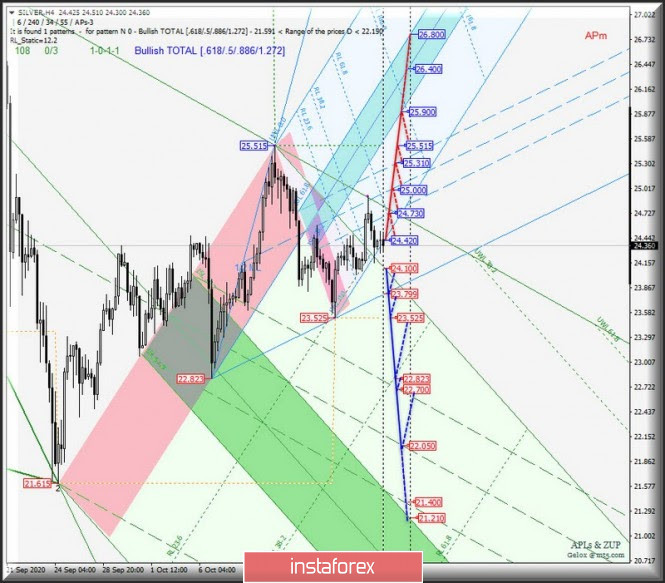
____________________
Spot Silver
Starting from October 20, 2020, Spot Silver will also develop its movement depending on the development and direction of the range breakdown:
In case of breakdown of the initial SSL pitchfork line of the Minute Operational Scale - support level 24.100 - the downward movement of Spot Silver may develop towards the following goals :
Upon breakout of the initial SSL Minuette line - resistance level 24.420 - the development of the Spot Silver movement will continue to the boundaries of the 1/2 Median Line Minuette channel ( 24.370 - 25.000 - 25.310 ) with the possibility of updating the local maximum 25.515 and reaching the lower boundary of ISL38.2 ( 25.900 ) of the Minuette Operational Scale pitchfork balance zone.
____________________
The review is made without taking into account the news background, opening of trading sessions of major financial centers and is not a guide to action (placing "sell" or "buy" orders).
You have already liked this post today
*บทวิเคราะห์ในตลาดที่มีการโพสต์ตรงนี้ เพียงเพื่อทำให้คุณทราบถึงข้อมูล ไม่ได้เป็นการเจาะจงถึงขั้นตอนให้คุณทำการซื้อขายตาม
เมื่อวันอังคาร คู่สกุลเงิน EUR/USD ยังคงเคลื่อนไหวขึ้นต่อหลังจากดีดตัวขึ้นจากระดับ Fibonacci retracement 50.0% ที่ 1.1590 นอกจากนี้ยังสามารถยืนเหนือโซนแนวต้านที่ 1.1637–1.1645 และไปถึงระดับ 1.1695 การดีดตัวจากระดับนี้จะเป็นประโยชน์ต่อสกุลเงินสหรัฐและสามารถนำไปสู่การลดลงไปยังโซน 1.1637–1.1645
ในกราฟรายชั่วโมง คู่เงิน GBP/USD ในวันอังคารอีกครั้งหนึ่งดีดขึ้นจากโซนแนวรับที่ 1.3416–1.3425 และเปลี่ยนเป็นผลประโยชน์ของปอนด์ จากนั้นกลับมามีเสถียรภาพเหนือระดับ 76.4% ของ Fibonacci ที่ 1.3482 ดังนั้น การเคลื่อนไหวขึ้นอาจดำเนินต่อในวันนี้ไปยังระดับ retracement
การวิเคราะห์แนวโน้ม (รูปที่ 1) ในวันพุธ จากระดับ 1.3495 (ราคาปิดรายวันของเมื่อวาน) ตลาดอาจมีการเคลื่อนไหวขึ้นไปต่อเนื่องไปยัง 1.3522 ซึ่งเป็นระดับการคืนตัวที่ 85.4% (เส้นประสีแดง) เมื่อทดสอบระดับนี้ ราคาอาจขึ้นต่อไปยัง 1.3587
การวิเคราะห์แนวโน้ม (รูปที่ 1) ในวันพุธ จากระดับ 1.1673 (จุดปิดของกราฟแท่งเทียนรายวันเมื่อวานนี้) ตลาดอาจมีการเคลื่อนไหวขึ้นต่อไปยังระดับ 1.1697 ซึ่งเป็นระดับการปรับตัว 76.4% (เส้นประสีเหลือง) เมื่อทดสอบระดับนี้แล้ว ราคาอาจมีการขึ้นต่อไปยังระดับ 1.1731
[XAU/USD] – [วันพุธที่ 13 สิงหาคม 2025] XAU/USD ดูเหมือนกำลังพยายามทดสอบระดับแนวรับที่ใกล้ที่สุด ซึ่งได้รับการยืนยันโดยตัวบ่งชี้ RSI (14) ที่อยู่ในพื้นที่ Neutral-Bearish และทั้งสอง
เมื่อวานนี้ ยูโรได้พยายามทดสอบแนวต้านเส้นสมดุลอีกครั้ง ครั้งนี้มีการสนับสนุนจากตลาดภายนอก — ดัชนี S&P 500 เพิ่มขึ้น 1.14% และได้สร้างจุดสูงสุดใหม่ตลอดกาล อย่างไรก็ตาม ยูโรยังไม่รีบเร่ง — ยังไม่มีการทะลุกรอบออกไปเนื่องจากใกล้จะถึงช่วงเวลา Fibonacci
เมื่อวานนี้ เงินปอนด์อังกฤษได้ใช้ประโยชน์จากความอ่อนแอชั่วคราวของดอลลาร์อย่างเต็มที่ โดยไปถึงระดับกลางที่ 1.3525 ตัววัดมาร์ลินกำลังเพิ่มขึ้นในเขตแนวโน้มขาขึ้น และตอนนี้ราคาจำเป็นต้องสร้างฐานเหนือระดับของเมื่อวานนี้เพื่อเปิดทางไปยังเป้าหมายที่ 1.3631 (สูงสุดของวันที่ 13 มิถุนายน) หรือสูงกว่าเล็กน้อย — ไปทางเส้น MACD อย่างไรก็ตาม
เมื่อวานนี้ ราคาซิลเวอร์เพิ่มขึ้น 0.41% ราคากลับขึ้นมาอยู่เหนือเส้นตัวชี้วัดสมดุล และ Marlin oscillator ซึ่งใกล้เคียงที่จะเคลื่อนเข้าสู่ดินแดนแนวโน้มขาขึ้น อาจจะเข้าร่วมในช่วงการเติบโตเร็วๆ นี้ การทะลุแนวต้านที่ระดับ 38.258 ซ้ำๆ อาจประสบความสำเร็จมากกว่าความพยายามที่ยังลังเลเมื่อวันที่
ถ้าทองคำลดลงต่ำกว่า 3,340 แนวโน้มอาจจะเป็นลบ แล้วมันอาจจะกลับมาเคลื่อนที่ลงอีกครั้ง และอาจคาดการณ์ได้ว่าเครื่องมือนี้จะถึง 5/8 ของ Murray ที่ 3,320 และสุดท้าย 4/8 ของ Murray ที่
InstaForex
บัญชี PAMM
Your IP address shows that you are currently located in the USA. If you are a resident of the United States, you are prohibited from using the services of InstaFintech Group including online trading, online transfers, deposit/withdrawal of funds, etc.
If you think you are seeing this message by mistake and your location is not the US, kindly proceed to the website. Otherwise, you must leave the website in order to comply with government restrictions.
Why does your IP address show your location as the USA?
Please confirm whether you are a US resident or not by clicking the relevant button below. If you choose the wrong option, being a US resident, you will not be able to open an account with InstaTrade anyway.
We are sorry for any inconvenience caused by this message.