

Актуальні патерни

Патерни - це графічні моделі, які "малюють" ціни на графіку. Один з постулатів технічного аналізу говорить нам про те, що історія (рух ціни) завжди повторюється. Це означає, що в схожих ситуаціях рух ціни, найчастіше, буде схожим, що дозволяє з високою часткою ймовірності спрогнозувати подальший розвиток ситуації.
Актуальні патерни від ІнстаФорекс - це зручний сервіс, який дозволить вам завжди бути в курсі останніх змін на ринку і вчасно реагувати на підказки, що з'явилися, від ринку. У нашому сервісі ви завжди знайдете найсвіжіші і актуальніші патерни на будь-якій парі і на будь-якому таймфреймі.
Медвежий флаг
сформирован 28.04 в 18:21:22 (UTC+0)
сила сигнала 1 из 5
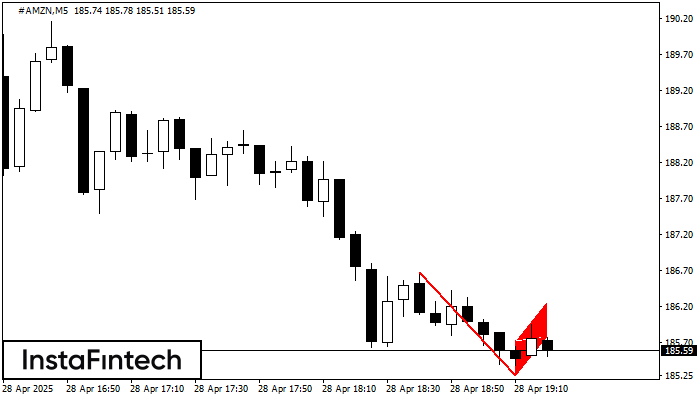
На графике #AMZN M5 сформировалась фигура «Медвежий флаг», которая сигнализирует о продолжении нисходящего тренда. В случае, если цена зафиксируется ниже минимума фигуры 185.25, движение вниз, скорее всего, продолжится. Перспективой будущего движения будет являться проекция высоты флагштока (10 пунктов).
Таймфреймы М5 и М15 могут иметь больше ложных точек входа.


