See also

 18.03.2026 12:46 AM
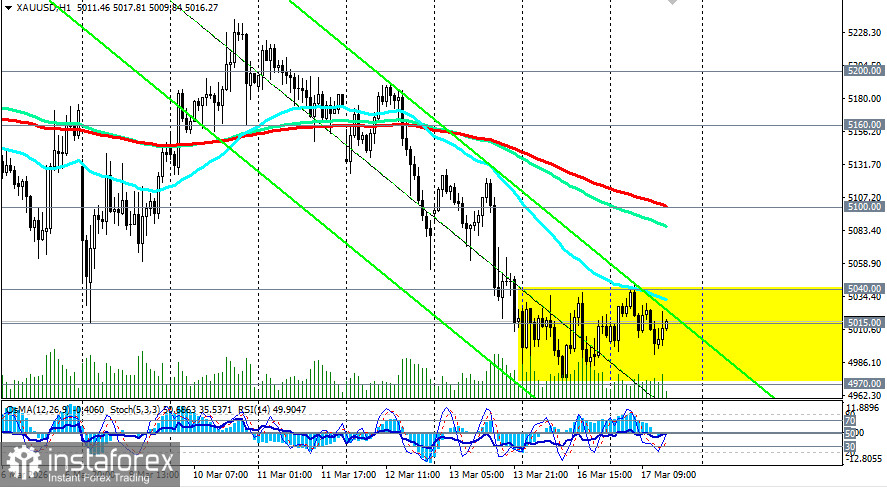
Gold continues to exhibit a dynamic that is mysterious to many investors: despite the weakening of the US dollar and the escalation of the Middle Eastern conflict, the precious metal remains in a narrow range around the psychologically important 5000.00 level.
The XAU/USD pair failed to capitalize on this classic growth opportunity, remaining virtually unchanged. The metal's price is consolidating just above the 5000.00 level, fluctuating in the range of 4970.00–5040.00 after Monday's fall to weekly lows.
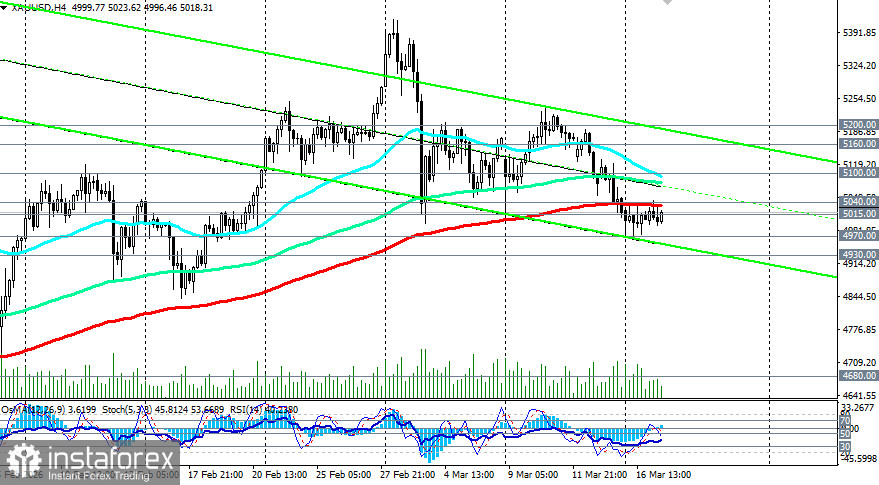
From a technical perspective, the XAU/USD pair is trading in a short-term bear market, below resistance levels at 5100.00 (EMA200 on the 1-hour chart) and 5040.00 (200-period EMA on the 4-hour chart).
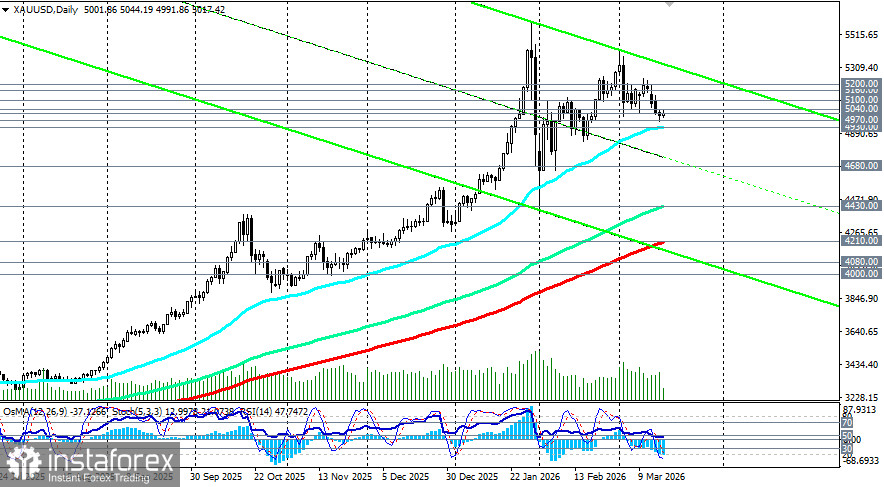
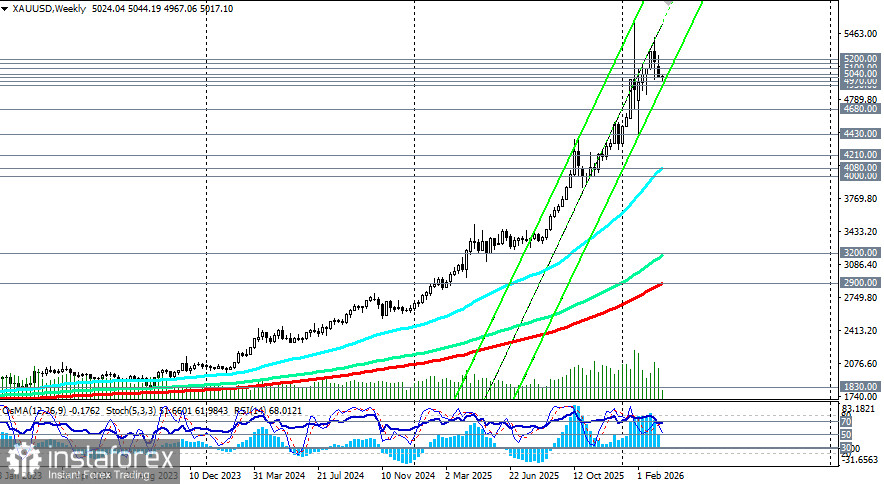
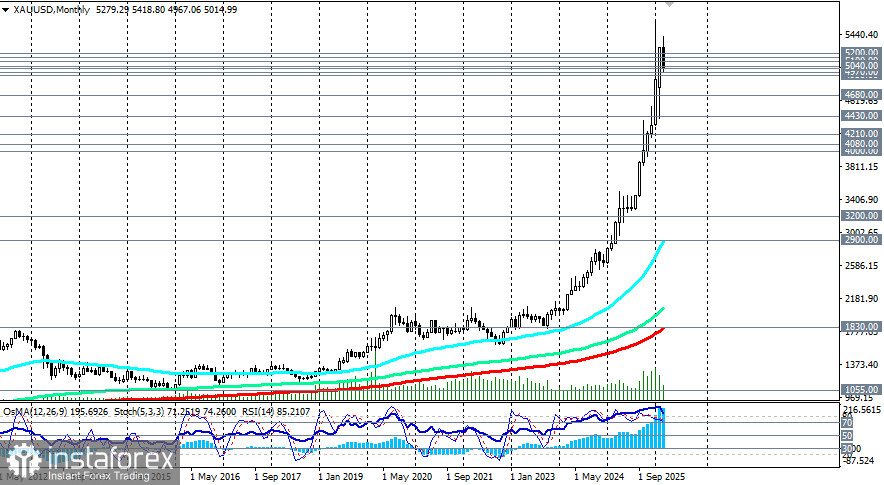
At the same time, an upward price trend is maintained, with a medium-term trend above the support level of 4210.00 (EMA200 on the daily chart), a long-term trend above the support level of 2900.00 (EMA200 on the weekly chart), and a global trend above the support level of 1830.00 (EMA200 on the monthly chart).
This maintains the long-term outlook for gold, which, in any case, acts as a traditional safe-haven asset, but is experiencing "temporary difficulties" in further growth for several fundamental reasons.
Wednesday's FOMC decision on interest rates will be a key catalyst for gold. Until then, gold will likely remain in the consolidation range of 4970.00–5040.00.
The Relative Strength Index RSI (14-day) has decreased to 47, indicating bearish momentum without entering oversold territory, while OsMA has continued to draw histograms of a bear market since March 4, signaling a strengthening downward trend.
Despite all this, the possibility of a short-term rebound to the zone of 5070.00–5100.00 cannot be excluded, but the overall short-term structure remains bearish as long as the price moves within short-term (1-hour and 4-hour charts) descending channels.
Occasionally, gold shows attempts at short-term recovery, but the current upward movement resembles a retest of resistance rather than the beginning of a strong bullish reversal. Buyers are only "catching" a short-term rebound, while sellers maintain an edge in the broader structure.
Despite current pressures, structural factors continue to support gold in the long term:
Historically, inflation shocks increase the attractiveness of gold as a means of saving and hedging against currency volatility, especially when geopolitical tensions and currency volatility rise simultaneously. The combination of technical probabilities of a return to higher average levels, geopolitical instability, and energy inflation creates a structural backdrop supporting higher gold prices in the upcoming monthly periods and cyclical intervals.
The "Targets" correspond to support/resistance levels. This also does not mean that they will necessarily be reached, but they can serve as a guideline when planning and placing your trading positions.


