
Vea también


 13.07.2026 05:20 AM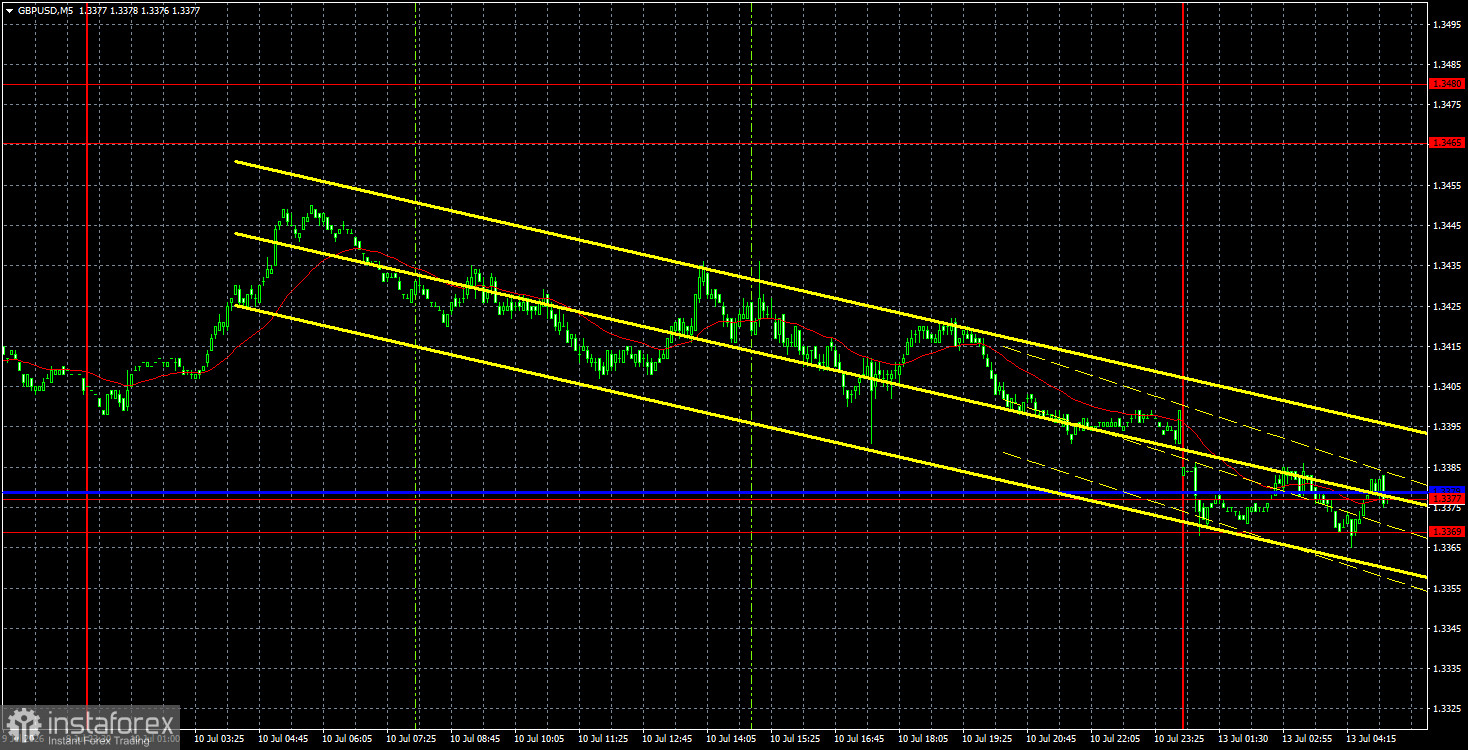
The GBP/USD currency pair slightly decreased on Friday within the upward trend of recent weeks; however, it maintained its trend. It is clearly visible on the hourly timeframe that the pair remains in an upward trend, so a bounce in the 1.3369-1.3377 area may trigger a new uptrend for the British currency on purely technical grounds. Conversely, consolidating below the 1.3369-1.3377 area would allow the pair to continue falling toward the Senkou Span B line. There were no important macroeconomic and fundamental events on Friday; however, over the weekend, it became known that there were new attacks by Iran on commercial vessels in the Strait of Hormuz, as well as strikes on U.S. military bases. Thus, geopolitics is heating up and becoming more complicated, which may support the American currency. As we can see, there is no talk of peace even after a peace agreement was signed in the Middle East. Oil prices have surged again, and at the current pace, they may continue to rise back to $100. The monetary policy of central banks will fully depend on inflation, which in turn is influenced by oil prices.
From a technical standpoint, the British pound remains within an upward trend, clearly indicated by the trend line. The area of 1.3369-1.3377 has been breached and now serves as support. In the coming days, the pair's movements will depend on whether or not the trend line is broken.
On the 5-minute timeframe on Friday, no trading signals were generated. The pair was in decline all day and only reached the 1.3369-1.3377 area last night. Therefore, a new signal may be formulated very soon, and on Friday, there were no grounds for traders to enter the market.
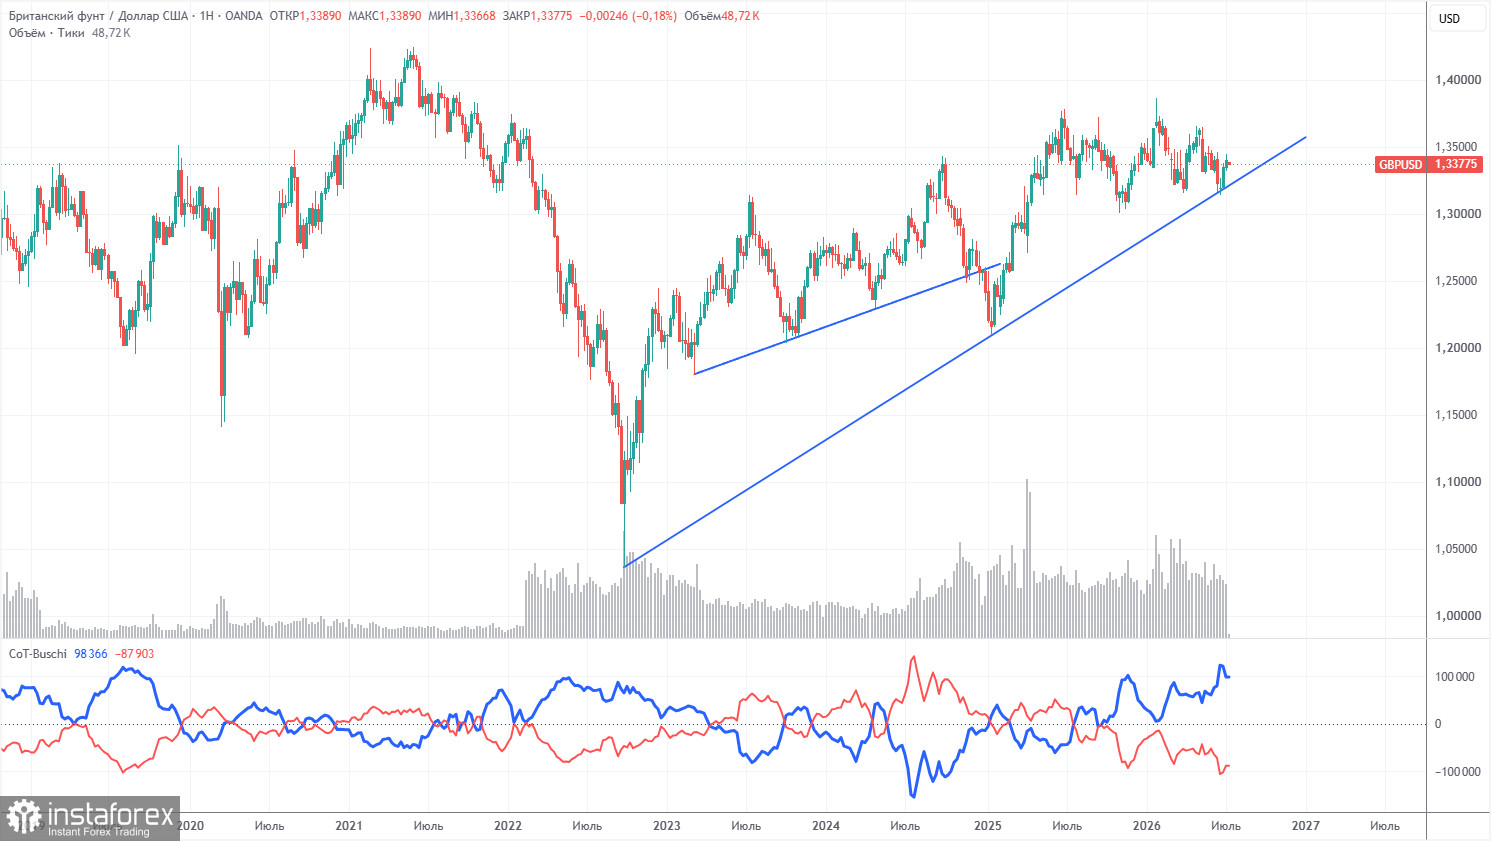
COT reports for the British pound show that non-commercial traders with sell positions have dominated the market for several months. The net position is negative, despite the long-term upward trend. Given the events in the Middle East, it's not surprising that demand for risk currencies remains weak. The war is formally over, but the conflict continues. Geopolitics may support demand for the U.S. dollar in the near term. However, until there is consolidation below the trend line, we would not expect a significant decline in the pair.
In the long term, the dollar will continue to decline due to Donald Trump's policies, as clearly illustrated on the weekly timeframe (illustration above). The trade war will continue in one form or another for a long time, and Trump's policies are aimed, directly and indirectly, at weakening the American currency. The long-term upward trend remains, as evidenced by the trend line. The price recently interacted with this line and bounced off it. According to the latest COT report (dated July 7), the "Non-commercial" group opened 7,400 BUY contracts and closed 6,800 SELL contracts. Thus, the net position of non-commercial traders increased by 14,200 contracts over the week, a change that does not significantly affect the overall sentiment of professional players.
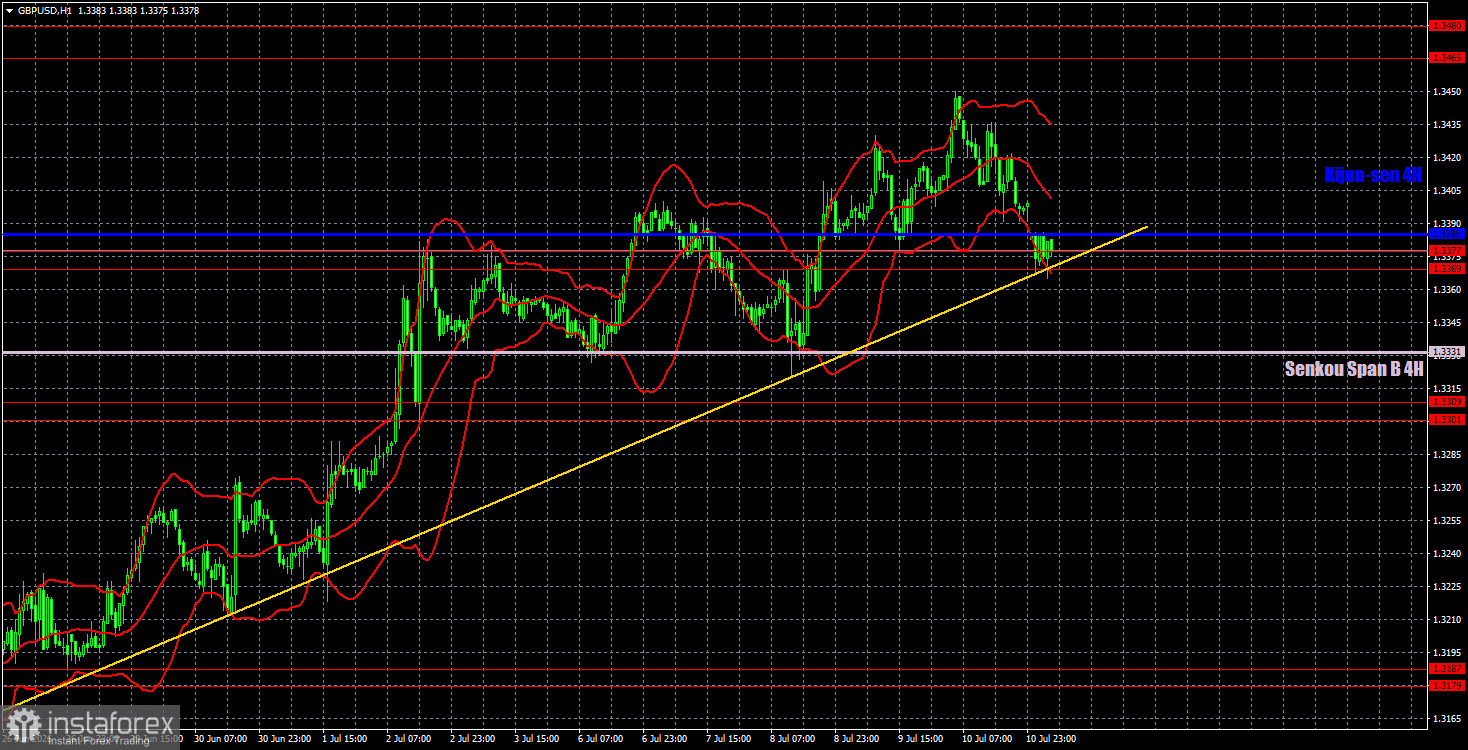
On the hourly timeframe, the GBP/USD pair continues to form an upward trend. In the long term, the British pound still has no strong reason to fall, while the U.S. dollar has no reason to rise. The market has recently ignored most fundamental, geopolitical, and macroeconomic events; on the daily timeframe, the pair has started moving from the lower boundary of the sideways channel to the upper boundary. Therefore, we still expect upward movement.
For July 13, we identify the following important levels: 1.3042-1.3050, 1.3096-1.3115, 1.3179-1.3187, 1.3301-1.3309, 1.3369-1.3377, 1.3465-1.3480, 1.3588, 1.3671-1.3681. The Senkou Span B line (1.3331) and Kijun-sen (1.3385) can also serve as sources of signals. It is recommended to set the Stop Loss to breakeven if the price moves in the correct direction by 20 pips. The lines of the Ichimoku indicator may shift throughout the day, which should be accounted for when determining trading signals.
On Monday, no important events or reports are scheduled in the United Kingdom, and the U.S. calendar of events is also empty. Thus, movements today will again be technical and likely weak.
Today, traders may open short positions targeting the Senkou Span B line if the pair consolidates below the 1.3369-1.3377 area. Long positions can be opened in the event of a bounce from the 1.3369-1.3377 area with a target of 1.3465.
Price support and resistance levels are marked with thick red lines, around which price movements may end. They are not sources of trading signals.
The Kijun-sen and Senkou Span B lines are Ichimoku indicator lines transferred to the hourly timeframe from the four-hour one. They are strong lines.
Extreme levels are marked with thin red lines from which the price previously bounced. They serve as sources of trading signals.
Yellow lines represent trend lines, trending channels, and any other technical patterns.
Indicator 1 on the COT charts shows the size of the net position for each category of traders.


