Xem thêm

 06.04.2023 09:41 AM
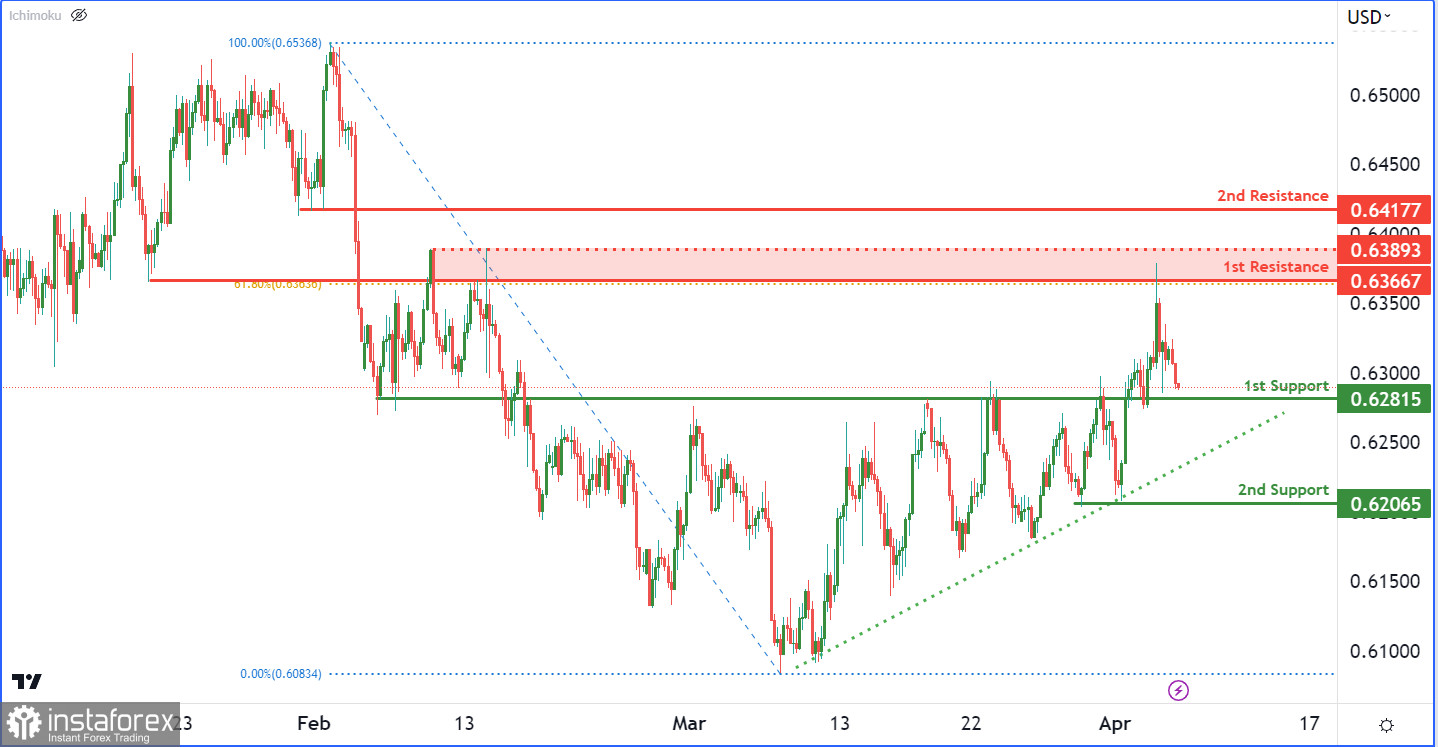
The NZD/USD chart currently displays bearish momentum with potential for further downside movement. Despite price being above a major ascending trend line that suggests bullish momentum, other factors suggest otherwise.
A potential bearish continuation towards the 1st support level at 0.6281 is likely. This level is an overlap support that may provide some support to price. Should the 1st support level be breached, attention should be given to the 2nd support at 0.6206, which has previously acted as a multi-swing low support and may offer stronger support to price.
On the resistance side, the 1st resistance level at 0.6366 is a pullback resistance that coincides with a 61.80% Fibonacci retracement level. If price manages to surpass the 1st resistance, the next level to watch is the 2nd resistance at 0.6417, which is also a pullback resistance level.
You have already liked this post today
*Phân tích thị trường được đăng tải ở đây có nghĩa là để gia tăng nhận thức của bạn, nhưng không đưa ra các chỉ dẫn để thực hiện một giao dịch.

