
Lihat juga


 13.07.2026 01:53 PM
A system breaks at its weakest point. Bitcoin had long held above the 200-week moving average — a threshold technical analysts traditionally link with the market entering a prolonged "bear" phase. The new round of hostilities between the US and Iran proved to be the strain that the support could not withstand.
Bitcoin dynamics at the 200-day moving average
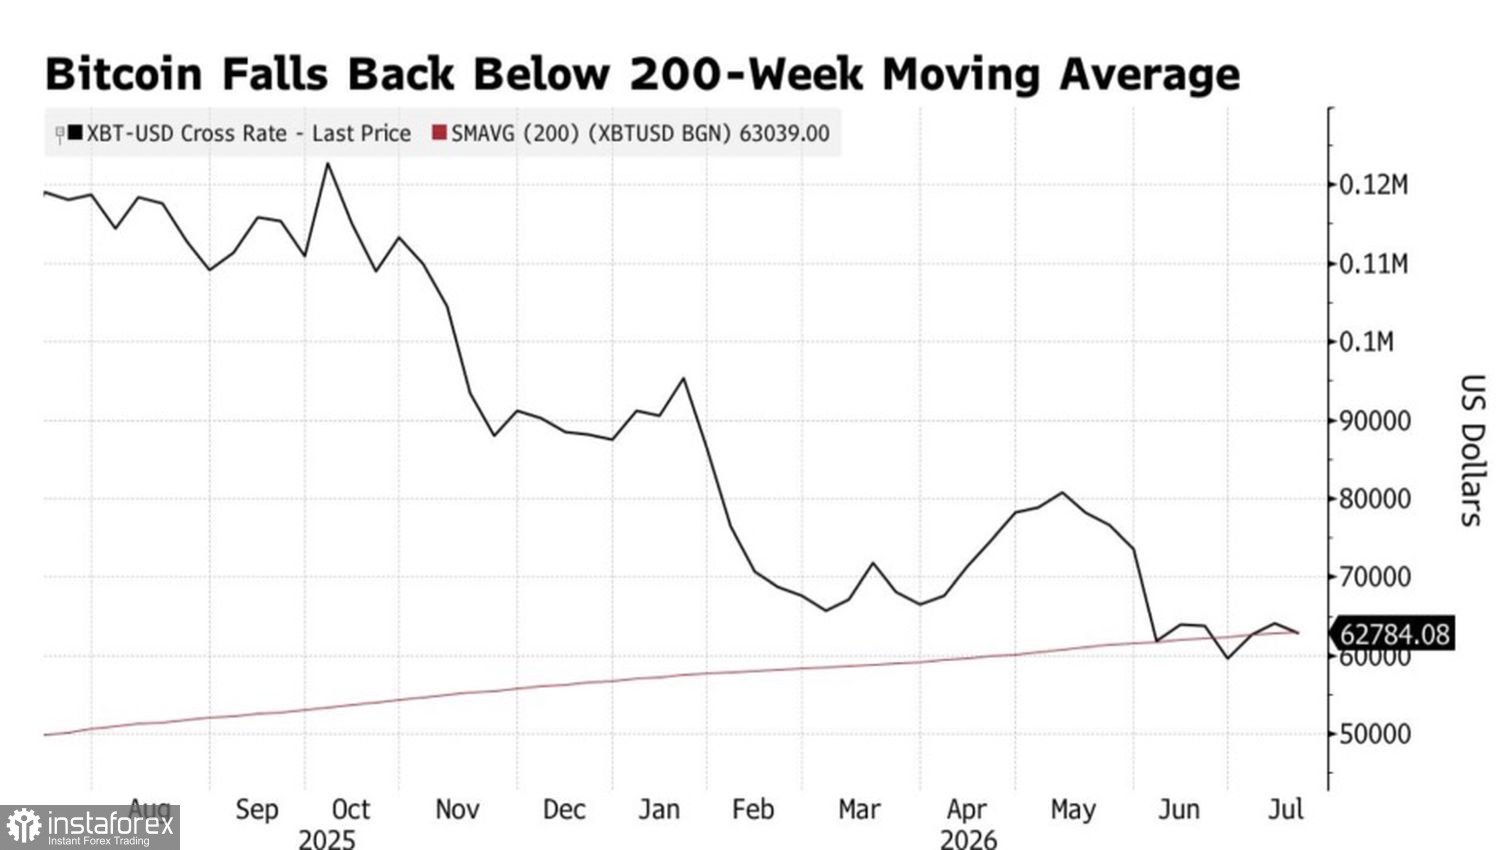
At the start of the week, on June 17, BTC/USD plunged more than 2% during the Asian session, rolling back below that technical level. The trigger was fresh US missile strikes on Iran over the weekend — a continuation of the strikes-and-counterstrikes cycle that has sadly become the region's norm. As usual, the parties disagree about whether the Strait of Hormuz remains open to shipping. Brent reacted decisively, jumping above $79/bbl.
Rising oil prices revive fears of accelerating US inflation and higher borrowing costs, which traditionally hits yield-free risk assets. Bitcoin is no exception. This week, markets will be watching the US consumer price report for June and Fed Chair Kevin Warsh's testimony before Congress. A hotter?than?expected CPI would strengthen expectations for tighter monetary policy through year?end and deal a blow to the digital asset; softer numbers, conversely, would support Warsh's earlier remarks about easing inflationary pressure and hand bulls a reprieve for BTC/USD.
The picture is not all one?sided. Last week, spot Bitcoin ETFs registered a net inflow of $197.4m for the first time in nine weeks. The contrast is stark: in June, more than $4.5bn flowed out of the funds — the worst monthly result since their launch in early 2024. In practice, Bitcoin still sits more than 50% below the October peak above $126,000.
There is, however, reason for cautious optimism. Glassnode's risk index fell to 0.56 for the week ending July 10 from a high of 1 at the start of the month — what the firm calls a "real signal of declining risk." The market also took Michael Saylor's Strategy sale of $216m in Bitcoin relatively calmly — a very different reaction than a month earlier, when the company's first sell?off since 2022 sent BTC/USD tumbling.
The paradox is clear: geopolitics and oil are pushing Bitcoin down, while structural signals suggest the panic may be running out of steam. Which force prevails will depend on the market's reaction to inflation data and the tone of the new Fed chair.
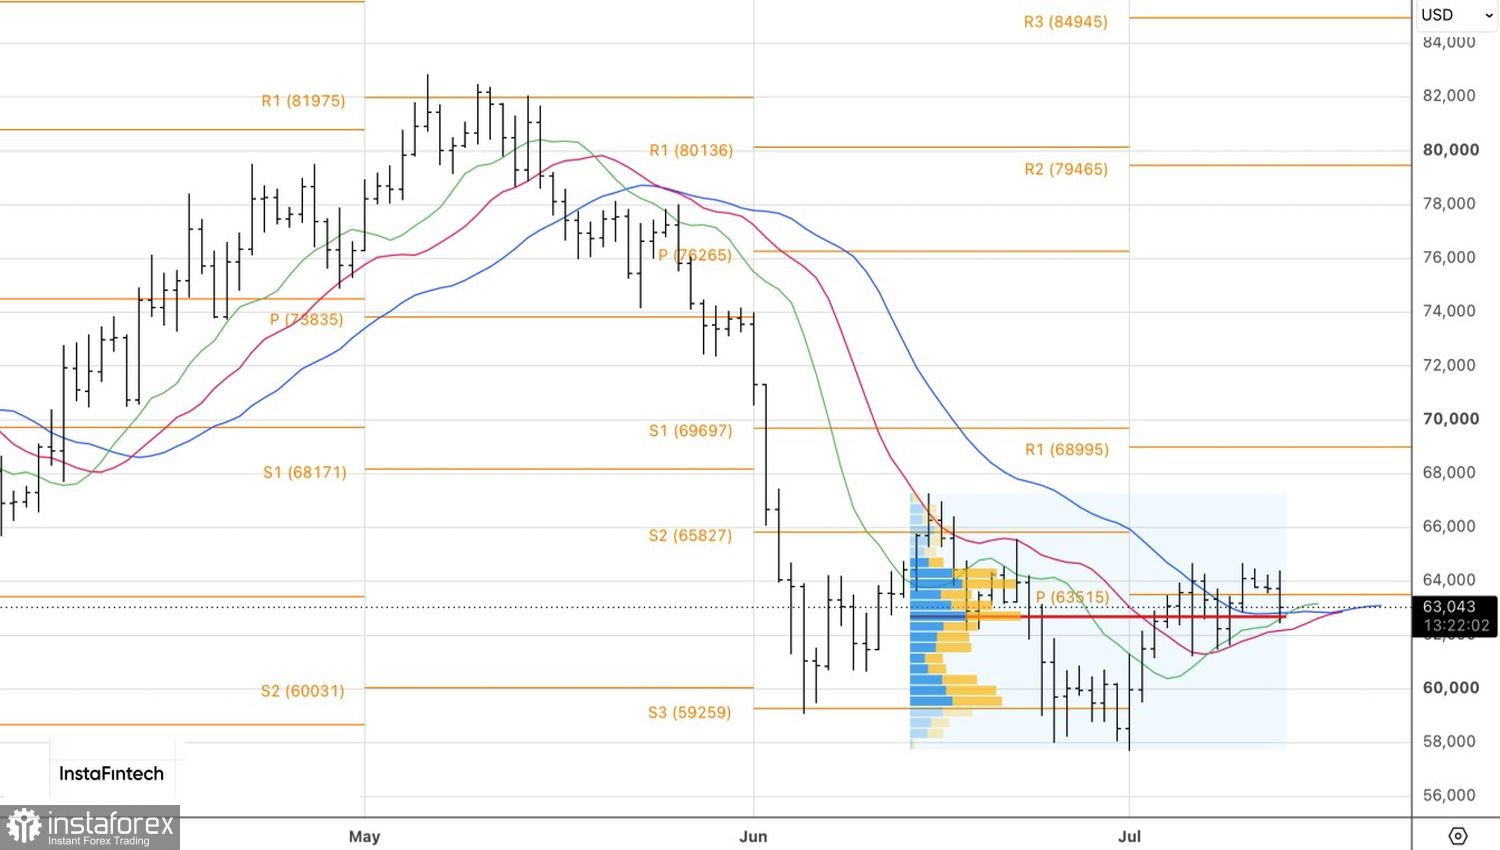
Technically, on the daily chart, BTC/USD is returning to key supports such as moving averages and fair value. A rebound from $62,600 would open the door back to buying Bitcoin. Conversely, a decisive break of that important level would be a signal to open short positions.


